
 plot(race[,1],race[,2]) -- Scatter Plot
 identify(race[,1],race[,2]) -- Identify Points
 lines(lowess(race[,1],race[,2]),lty=2,col=3) -- Curve-Trend
 abline(l1fit(race[,1],race[,2]),lty=1,col=5) -- Best-Fit Line
 symbols(race[,3],race[,8],circles-race[,1],inches=1) -- Symbol
For the convenience of the class in future terms to use our data and graphs, we have programmed functions into the network's shared directory. The entire data set (all information in the table) can be found by simply typing:
MATH 150> race
To make the graphics window create a graph of, for example, Price versus Acceleration from 0-100 Miles per Hour (in Seconds), simply enter:
MATH 150> race.accel100()
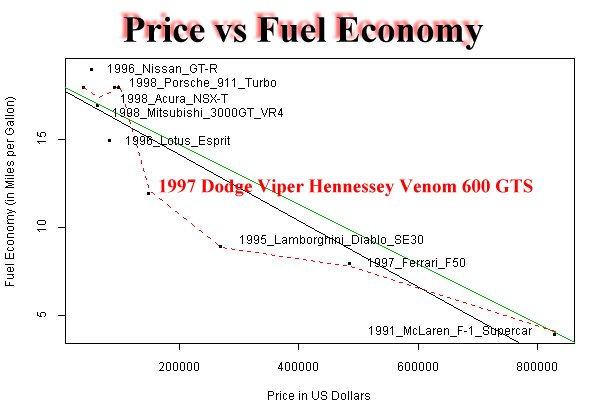
This will then produce the graph pictured here (with the exception of the red label for the Dodge Viper, which I have added in Paint Shop Pro for viewing convenience):
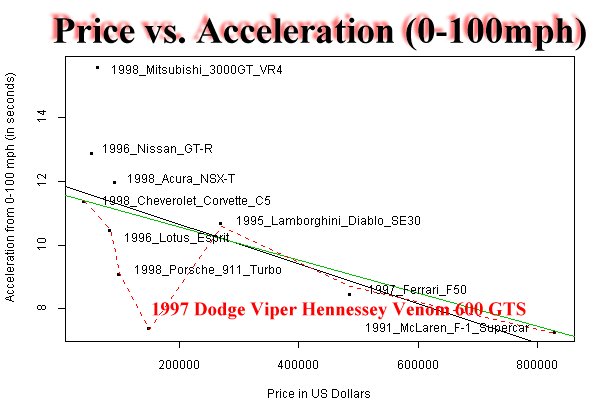 |
From this graph, we can see that the Viper stands out of the normal trends for it's price range. The Hennessey Venom 600 GTS will reach 100 miles per hour in just under 8 seconds-- for a relatively inexpensive $150,000. According to the best fit lines, a car of this calibur should cost just over three-quaters of a million dollars ($750,000).
Several more of these scatter plot graphical intrepretations can be viewed by scrolling below. Here you will discover scatter plots of all the data with respect to price. For individual graphs, please use this list:
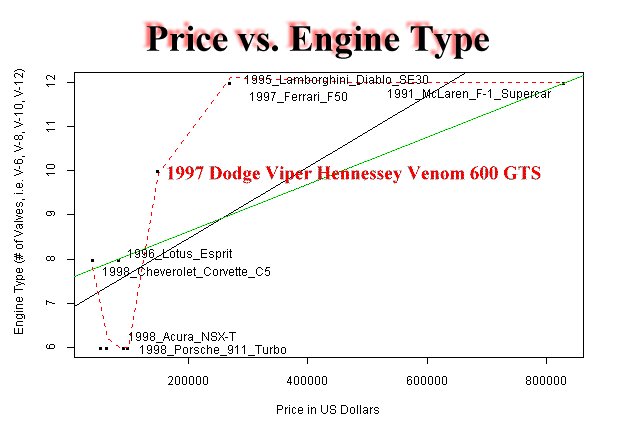 |
Above is the scatter plot of the Prive versus Engine Type (Valve Size). Notice that there are only 4 distinct levels of engine size-- those cars with a V-6 (or other type of 6-valve engine, i.e. Straight-6 or In-Line 6), V-8, V-10, and/or V-12. We can see that the Dodge Viperhas a V-10 Engine in a price range that should, according to the trend lines provided, cost just over $400,000. It is interesting to note, however, that most of the cars are not on the trend-line, for example, the Lamborghini Diablo SE30 is also a good buy, while the Acura NSX-T and the Porsche 911 Turbo appear to be rather expensive for their engine sizes. This conclusion is not valid, however, because other factors must be taken into account, including car size and weight that the engine must propel. But any way you look at it, the 1997 Dodge Viper Hennessey Venom 600 GTS is an amazing buy for a V-10 engine!
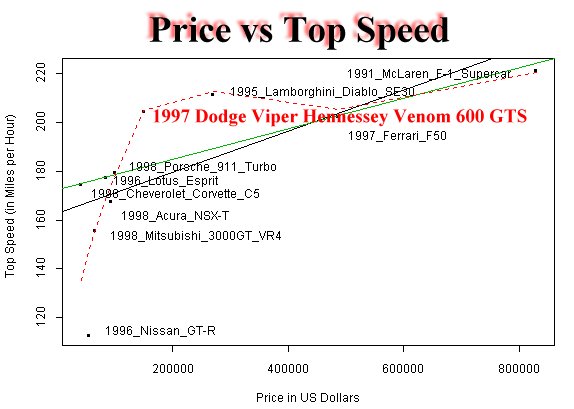 |
Again the Dodge Viper breaks the trend-line for the Price versus Top Speed graph depicted above. We can comparatively see that a car with a top speed of 205 mph should cost close to $600,000. Most of the cars in our data follow the trend-lines of least-fit and least-squares fit pretty well, with the exception of the Lamborghini again with a higher-than-expected mark, and the Nissan GTR which has a noteably lower top speed than the competition-- this is an invalid outlier because the Nissan GTR's top speed index is digitally limited by the government's request.
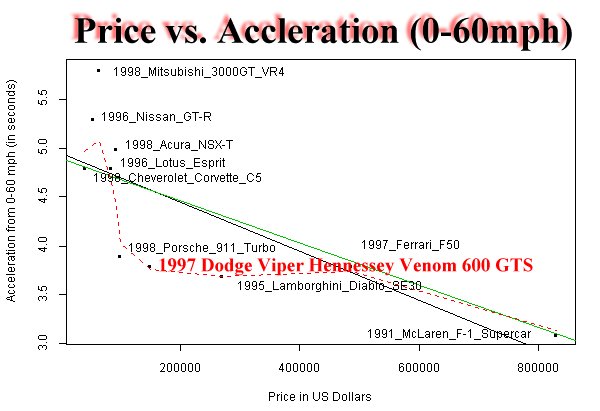 |
Leaps in acceleration from 0-60 miles per hour (in seconds) are seen by the Porsche 911 Turbo, the Dodge Viper, and the Lamborghini. Porsche appears to be the "winner" in this category (with respect to Price), however, the Dodge Viper still contends with a definite presence.
|
|
The 1997 Dodge Viper Hennessey Venom 600 GTS again pulls the lowess curve to a low level, exemplifying its ability over the other cars in our study. A complete comment on this graph is available at the top of this page (or on the index.html page).
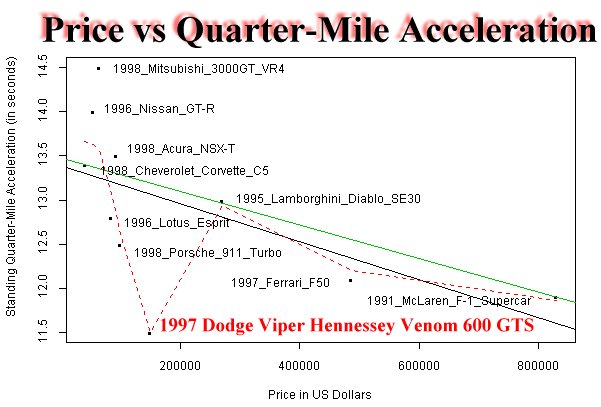 |
It appears that the quarter-mile acceleration is where the Dodge Viper shines! With respect to all other cars on the graph, the Viper should be the most expensive-- but its price is only an eigth of that of the McLaren F-1 Supercar! Dodge has created a car with enough torque and power to propel it into the lead among quarter-mile accelerators.
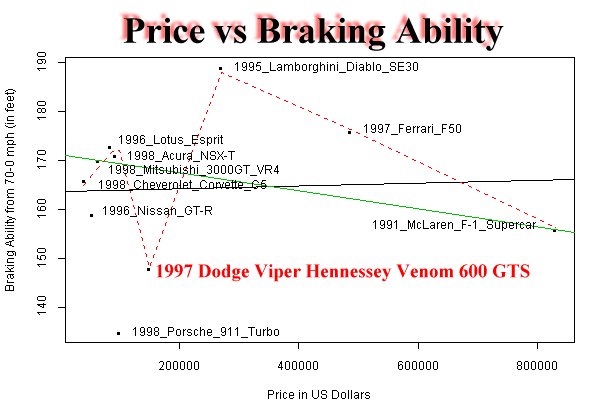 |
Sure the Viper can accelerate and has an amazing top speed, but can its 4-vented disc breaks stop the ton-and-a-half beast in a comparable breaking distance as the reast of the field? The answer according the the graph above is a definite yes! The only car to out-break it is the tiny Porsche 911 Turbo.
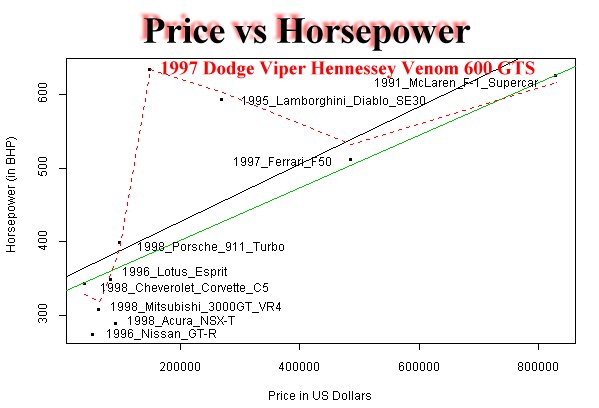 |
The Dodge Viper stands high above the rest in horsepower. The mark of a powerful car that would make even Tim Allen hoot is the "number of horses under the hood". The Viper contends only with the $830,000 McLaren F-1 Supercar in this division, but even surpasses its ability for a fraction of the cost.
 |
The undisputed champion of all sports cars in the Torque division is the Dodge Viper. The amount of torque that the Venom V-10 Engine puts out is comparable only to racing edition supercars, and even beats NASCAR levels. It is by far the most dangerous car on the road-- and for a mere $150,000 it is a steal.
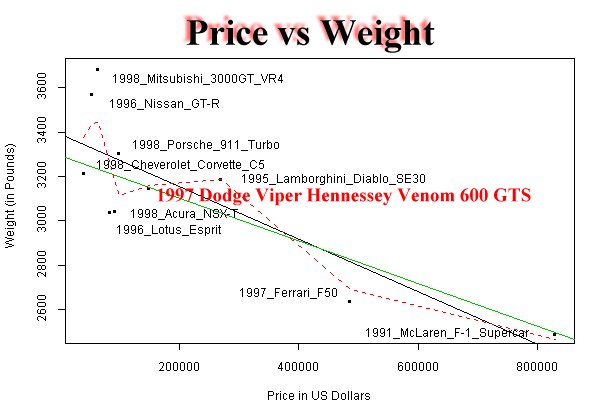 |
With all these features mentioned above, the Viper still remains centered in the field with an average weight for its price. We can see that the more a car costs, the lighter it becomes.
 |
So, with all this power and the Viper's unmatched Engine, what kind of mileage will this infernal rocket get on a gallon or regular high-octane fuel? Quite surprisingly, a relatively high 12 miles to the gallon! The more "exotic" and expensive an automobile gets, there seems to be an unwritten rule which says its gas consumption increases at a comparable rate, but the 1997 Dodge Viper Hennessey Venom 600 GTS has a high Fuel Economy rating relative to its mates in Speed, Power, and Acceleration.
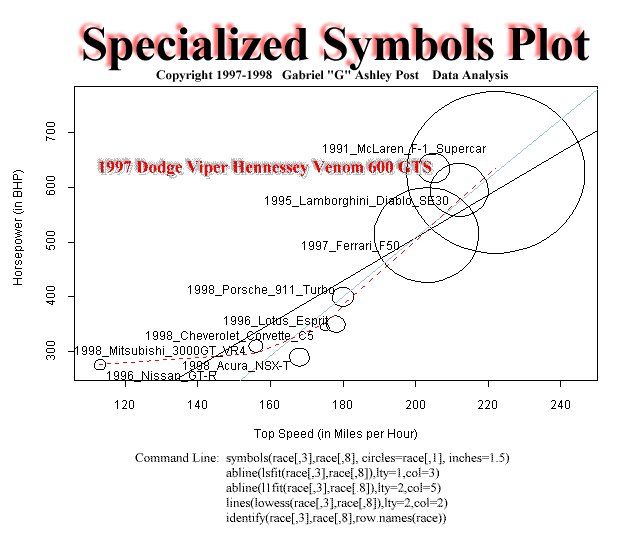
Probably the most descriptive of all the S-Plus graphical analyses we have discovered in this project, was the symbolic graph of the two most popular components-- Top Speed and Horsepower. In the graph below, a scatter-type plot of Top Speed verses Horsepower is depicted, with the area (size) of the circles representing the prices of the vehicles. An identify feature was included to label the automobiles.
 |
For an easy comparision of all the data included in this project, we have included a generalized "draftsman's plot" below. This graph will allow you to look at any specification versus any other specification (i.e. Top Speed versus Torque or Braking versus Weight). For your convenience, we have also included a special feature which has circled all the data points for the 1997 Dodge Viper Hennessey Venom 600 GTS so you can more easily compare the Viper with the overall trend of high-performance cars we have analyzed.
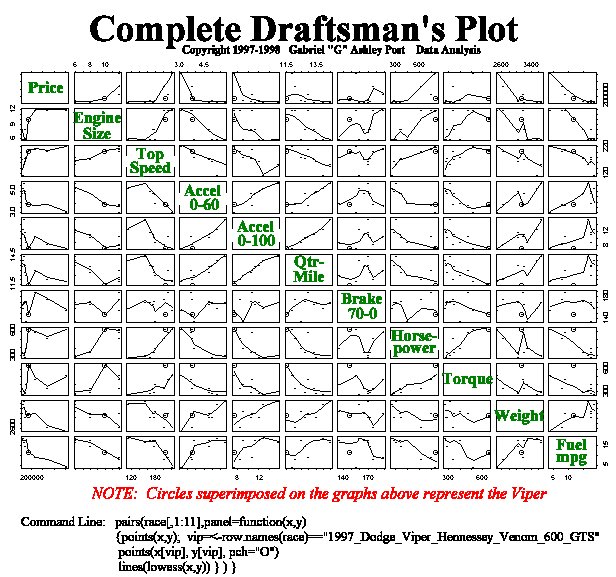 |
From this graph we can see the many ways that the Viper exercises superiority over the other cars included in our analysis of the world's best high-performance vehicles. At the bottom, I have also included the command line in S-Plus for the construction of this generalized draftsman's display so future S-Plus programmers can try this out for themselves. Again, special features were added on Paint Shop Pro for ease of understanding.
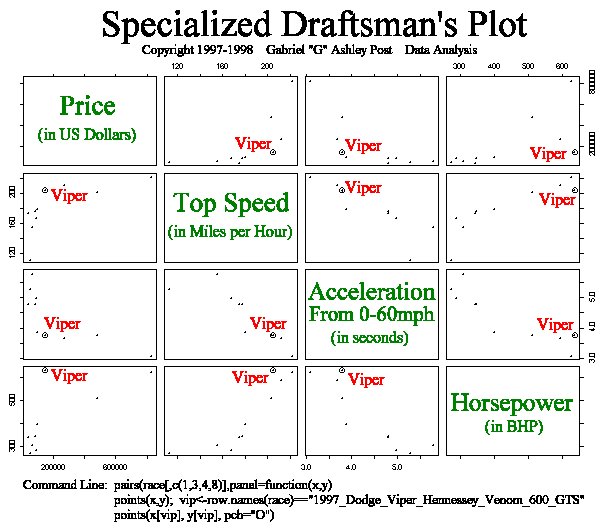 |
Here is a specialized draftsman's display of certain chosen statistics from the generalized plot previously displayed. With this graph, you can more easily see the comparision of Price to Top Speed to Acceleration (0-100 mph) to Horsepower. Again, for your convenience, I have labeled the Viper's Points. Price vs. Top Speed: For a relatively low cost, there is a high Top Speed. Price vs. Acceleration: For a relatively low cost, the Viper is a very quick accelerator. Price vs. Horsepower: For a relatively low cost, the Viper's Horsepower is extremely high. Top Speed vs. Acceleration: The Viper fits the trend of High Top Speed and Quick Acceleration, on the better end of both. Top Speed vs. Horsepower: The Viper's point is at the top of the window for Horsepower as well as to the far right, the faster side, for Top Speed. Acceleration vs. Horsepower: Third Quickest Acceleration time and the best Horsepower rating-- a data point which places the Viper in the extremes of the best.
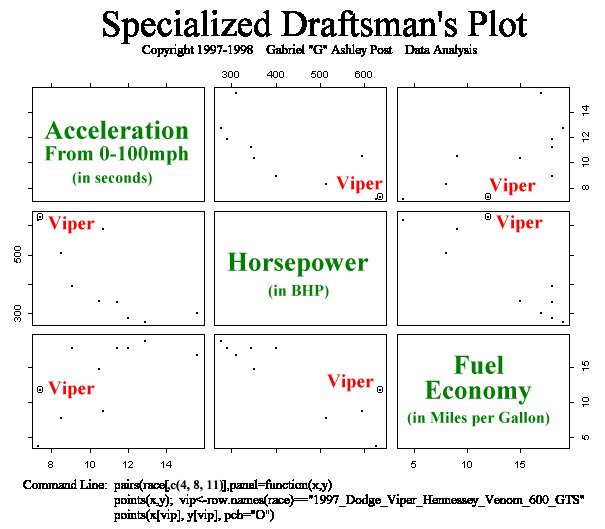 |
Another, even more easily-readable draftsman's display is depicted above with Acceleration (0-100 mph), Horsepower, and Fuel Economy.Acceleration vs. Horsepower: The Viper sits high in the upper extreme of both Acceleration and Horsepower ratings. Acceleration vs. Fuel Economy: As a machine with extremely high Acceleration, the Viper is comfortably nestled at an average fuel consumption. Horsepower vs. Fuel Economy: Again, the Viper shows its strength in Horsepower with an average Fuel Economy of 12 miles per gallon.
Copyright 1997-1998
Gabriel "G" Ashley Post
For questions or comments, E-mail Me!DISCLAIMER and Copyright notice: This page was created for Mathematics 150: Data Analysis at Occidental College, Los Angeles, California. Information may not be stolen from this page without the concent of the author, unless you are within the Occidental Community, for which I grant full access. The photographs contained on this page (and on my immediate links) are not of my origin, they are the copyrights of the respective pages from which they are linked to on the "Cars Individually" section. Thank you for your cooperation.