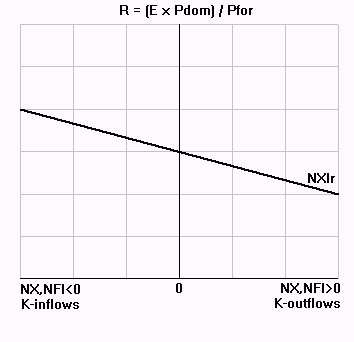
Note: As elasticities rise over time, the situation reverses and the trade balance rises. |
 |
||||||||||||||||||||
IV. Macroeconomic activity in a global economy
B. International investment
3. Open-economy macroeconomics
d. The J-Curve
"Perverse" effects of exchange rate
changes
? Whenever OPEC raises its oil prices, is that real depreciation or real appreciation for them?
? So, what should happen to their CAB?
This is the opposite of what actually does happen
So, what's wrong with our analysis so far?
--Lesson of this section: exchange rate changes can have current-account effects that are contrary to what we generally expect, especially in the very short run.
Analytical question: what makes this happen? Sufficiently inelastic demands for tradables
See J-Curve worksheet
Intuition:
NX$ = X$ - M$
1% of real depreciation
=> imports 1%
more expensive
--Bad news for trade balance
--For trade balance to rise, trade volumes must offset this
price effect
Ex.1: Qx rises > 1%
Ex.2: Qm falls > 1%
Ex.3: Any combination of 1 and 2 which adds up to > 1%.
Usually met, especially in long run. But not always so as mentioned abouve.
Note: if either elasticity > 1 we're O.K.
Example: For OPEC: can't determine the effect of an ER chagne by
looking only at the elasticity of demand for OPEC oil. Need to know OPEC elasticity of
demand for imports too. Their short-run demand for our goods rose only a little with their
new-found wealth.
Result: -R --> +NX only if:
|%DQx| + |%DQm| > |%DR|
=> |%DQx/%DR| + |%DQm/%DR| > 1
=> foreX + domeM > 1
| The Marshall-Lerner condition: A real depreciation raises net exports if and only if: | ||||
| foreX | + | domeM | > 1 | |
| foreign elasticity of demand for exports |
domestic elasticity of demand for imports |
|||
See: Devaluation case studies handout
Return to example of expansionary MP
? In foreign-sector diagram, how
does NX look when we have a J-curve?
Note: As elasticities rise over time, the situation reverses and the trade balance rises. |
 |
||||||||||||||||||||
EX: UK: LR elasticities:
eX by ROW = 0.48 / eM by UK = 0.65
eX + eM = 0.48 + 0.65 = 1.13, but lower in short run
| Note: Contractionary depreciation is possible: | |
| +MP --> -r --> | +I --> +Y |
| -R --> -NX --> -Y | |
Note3: Depreciation with J-curve => K-inflows
occur despite our lower interest rate
Why? Super appreciation anticipated
Essentially, J-curve = a special case of overshooting
How long is long?
Old wisdom: 6-9 months
New claim: elasticity = 50% of long-run elasticity after 2 years, 90%
after 5 years