
However, not all of these nonnegative solutions are feasible, because some are ruled out by the two functional constraints,
We will begin by focusing on the constraint ![]() .
.
| The Graphical Method - Feasible Region | Previous | Next |
 |
 |
||
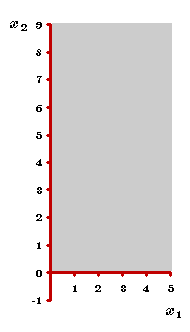
| The first part of the graphical method involves constructing the feasible
region in the graph on the right. As a starting point, the current
shaded region in this graph shows solutions that are permitted by the two
nonnegativity constraints, highlighted above.
However, not all of these nonnegative solutions are feasible, because some are ruled out by the two functional constraints, |
|||
| |
|||
| We need to identify graphically which nonnegative solutions are permitted
by each of these functional constraints.
We will begin by focusing on the constraint |
|||