| Ex: Own-price elasticity of
demand:
DQd/avgQd We use avgQ and avgP so we get the same percentage answers whether P rises or falls. Consider D with two points: Worksheet: Elasticity review |
 |
I. Review of markets
B. Elasticity
Recall: Sometimes it is not enough to know the direction in which Qd or Qs changes as a result of some shock to an equilibrium.
Sometimes we want to measure how much Qd or Qs changes--i.e., responsiveness
Elasticity does this.
Handout: Elasticity
formulas
Worksheet: Elasticity review (tip: recall the arc
elasticity formula)
General formula for market elasticities (e):
%DQ
e = ---------
%DX
where X=something which influences Q, such as price (P)
Larger elasticity => greater responsiveness
(1) Real world relevance: direction vs. size of change in Qd.
(2) Percentages are the key
Across goods: Asahi vs. Mazda
Over time: $400 change in PC prices
There are many elasticities:
Own-price elasticity of demand:
%DQd
e = ----------
%DP
e is negative, but we'll usually drop the minus sign.
Income elasticity of demand:
%DQd
eI = ----------
%DI
Cross-price elasticity of demand:
%DQdx
ex,Py = -----------
%DPy
Elasticity of supply:
%DQs
eS = -----------
%DP
1. CALCULATING ELASTICITY
a. ARC ELASTICITY
Arc elasticity (eARC): elasticity for a distinct pair of points (X1,Q1) and (X2,Q2):
DQ/avgQ
eARC = --------------
DX/avgX
where
DQ=(Q2-Q1)
avgQ=(Q1+Q2)/2
DX=(X2-X1)
avgX=(X1+X2/2.
| Ex: Own-price elasticity of
demand:
DQd/avgQd We use avgQ and avgP so we get the same percentage answers whether P rises or falls. Consider D with two points: Worksheet: Elasticity review |
 |
Point elasticity gives you a precise estimate of elasticity; as the name suggests, at a specific point
Ex: own-price point elasticity of demand:
| %DQd | DQd/Qd | DQd | P | P | |||||||
| e = | ---------- | = | ----------- | = | ------ | · | ---- | = | dQd/dP · | ---- | |
| %DP | DP/P | DP | Qd | Qd |
where, at the point (Qd,P):
dQd/dP = the derivative of D, and
P/Qd = the ratio of P to Qd.
point e = dQd/dP · P/Qd
Since dq/dp is negative by law of demand, e < 0.
By convention, we often drop the sign on own-price elasticity of
demand, or talk only about its size (I do that, text doesn't).
I don't care which you use
Example: linear demand for movie theater tickets:
Qd = 4771 - 656 P
dQd/dP = -656, drop (-) sign =>
e = dQd/dP · P/Qd
= 656 · P/Qd
P = 5 =>
Qd = 1491 =>
e = 656 · 5/1491 = 2.2
Geometry and calculations (Excel)
| Point elasticity with
linear demand: the general case
Qd = a - bP => b is constant ? P=0 => Qd = ? ? Qd = 0 => P = ? |
|
| ? At
(Qd=a,P=0), e=?
|
? At
(Q=0,P=a/b), e=?
|
| Now consider the point exactly halfway down the demand curve. | |
| ? P=?
|
? Qd=?
|
To do on homework: Use the P and Qd information and the linear elasticity formula to prove that halfway down a linear demand curve: e = 1 (demand is unit elastic).
So note that a linear demand curve contains all the
possible elasticity values:
(1) elasticity drops continuously from infinity to 0 as you move down
the demand curve.
(2) elasticity switches from elastic to inelastic exactly halfway down.
Note: The simple formula here holds only for linear demand, not all demand curves.
2. PRICE ELASTICITY (e) AND TOTAL EXPENDITURE (TE)
TE = P·Q
+P --> -Q (by law of demand)
DTE = ?
P and Q move in opposite directions when we move
along D, so which effect wins?
e tells us: e = %DQ/%DP
| Product | Elasticity | Type of elasticity | %DP | %DQd | Approx. %DTE | Which effect wins, P or Q? |
| Baseball tickets | 1.0 | -10 | ||||
| Milk | 0.5 | -10 | ||||
| Movie tickets | 2.2 | -10 |
Rules:
(1) |e| < 1: inelastic: P and TE move in the same direction
(2) |e| > 1: elastic: P and TE move in opposite directions
(3) |e| = 1: unit elastic: TE is constant as P changes
? Your advice to theater owner to raise revenue?
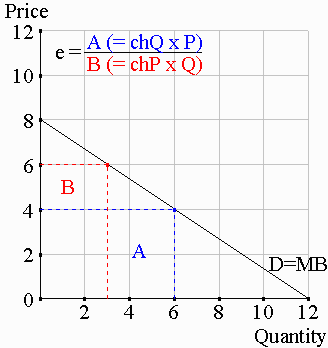
| How does the geometry look? DQd
P A in the diagram to the right. So in terms of geometry, elasticity corresponds to
the ratio of area A to area B when price changes. |
 |
(One final note: Recall that for a linear demand curve, demand is elastic until halfwy down the curve; then it becomes inelastic. That means that lower prices keeps raising P·Q until the midpoint; after that, P·Q starts to fall again. So for a linear demand curve, TR and TE are maximized at the midpoint price and quantity.)
3. APPLYING PRICE ELASTICITY
Ex.1: U.S. sugar quotas
Ex.: Tax incidence (Java)
Who really pays a tax? The answer is given by 'tax incidence' which breaks a tax into the percentages paid by buyers and sellers. How a tax gets divided depends on the elasticities of demand and supply.
For any good:
Pb=Price buyers pay
Ps=Price sellers receive
A per-unit tax (t) raises Pb above Ps by the amount t:
Pb - Ps = t => Pb = Ps +t
| Diagramming a per-unit tax: 1. shift S up by the amount of the tax. 2. find the new Q, Qt. 3. find the new PBt, given by the height of the demand curve at Qt. 4. find the new PSt by subtracting the tax from PBt. Tax incidence on buyers: Tax incidence on sellers: |
|
Note that who pays a tax depends on the shapes of D
and S.
In general, the party which has the lower elasticity gets 'stuck'
paying more of the tax
Gasoline: demand is pretty inelastic
Labor market: supply is pretty inelastic
These results are true regardless of what any laws say.
A per-unit subsidy (sub) raises Ps
above Pb by the amount sub:
Ps - Pb = sub => Ps = Pb + sub
To draw it: shift S down by size of subsidy