Applying price elasticity: U.S. sugar quotas
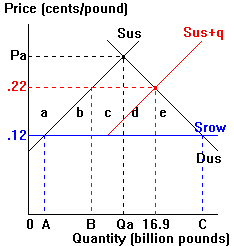
 Use the letters and numerical values from the diagram to the right to help you complete
the information in the table below.
Sus = the supply curve of domestic producers
Srow = the free-trade supply curve by the "rest of the world"
(ROW), showing that we can buy as much sugar as we please at the going world price
Sus+q = the supply of domestic producers plus the quantity allowed in
under the quota (q).
| |
No trade |
Free trade |
Trade with quota |
| Price |
Pa |
$.12 |
|
| Consumption |
Qa |
|
|
| Production |
Qa |
|
|
| Imports |
0 |
|
|
Comparing the quota to free trade, indicate the areas in the diagram corresponding to:
the change in U.S. consumer surplus: _________
the change in U.S. producer surplus: _________
Suppose that between the free-trade and quota price the arc own-price elasticity of
demand for sugar is 0.35. Use this information to calculate actual numerical answers to
each of the following:
quantity of sugar consumed under free trade (C in the diagram):
_________ billion pounds
(Hint: use the arc-elasticity formula and rearrange terms to solve for
C.)
change in consumer surplus caused by the quota: $_________ billion
dollars
 Use the letters and numerical values from the diagram to the right to help you complete
the information in the table below.