To derive [a] firm's supply curve we assume that the firm chooses a quantity of production that maximizes profits. This is the assumption of profit maximization.... [P]rofits depend on the quantity produced, and we can...show how the firm chooses a quantity to maximize profits.
Deriving a Firm's Supply Curve from Its Marginal Cost
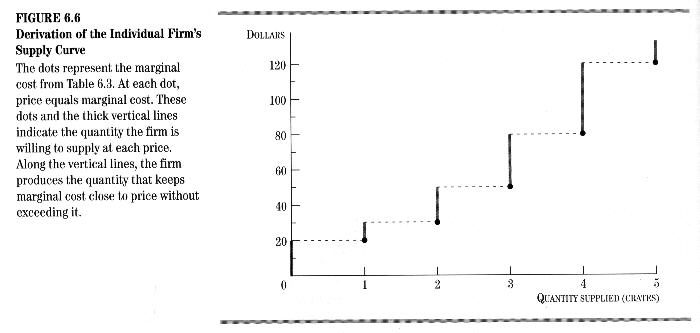
...[W]e first plot the marginal cost [of production...] in Figure 6.6. Focus first on the black dots in Figure 6.6; We derive the lines in the next few paragraphs. Each dot in Figure 6.6 represents the marginal cost of producing grapes at different levels of production. Figure 6.6 summarizes all that we need to know in order to find the quantity a profit-maximizing firm will produce.
Finding the Quantity Supplied at Different Prices
Suppose the price of grapes is $100 a ton. Mark this point on the vertical axis of the diagram in Figure 6.6 with an arrow. We are going to derive the supply curve for this firm by gradually raising the price from the low $100 value and determining how much the firm would produce at each price. At $100, the price is less than the marginal cost of producing one unit, which is $200, according to Figure 6.6. Would it make sense to produce a ton of grapes at this price'? No, because producing 1 ton of grapes has a marginal cost of $200. The additional revenue that comes from producing 1 more ton is $100. The additional, or extra, revenue that results from producing and selling one more unit of output is called marginal revenue. Because laying out $200 and getting back $100 reduces profits, the farmer would not bother to produce 1 ton. In other words, the marginal cost of increasing production from 0 to 1 ton would be greater than the marginal revenue from selling 1 ton. Producing nothing would be the profit-maximizing thing to do.
Suppose the price of grapes rises. Move your arrow up the vertical axis of Figure 6.6. As long as the price is below $200, there is no production. Thus, the amount supplied at prices from $0 to $200 is given by the thick line at the bottom of the vertical axis where quantity supplied equals zero.
Suppose the price rises to $200. Now the price equals the marginal cost, and the additional, or marginal, revenue from selling a ton of grapes will just cover the marginal cost of producing the ton. The farmer now has sufficient incentive to produce a ton of grapes. Strictly speaking, the price would have to be a little bit greater than $200 (say $200.01) for the farmer to earn more producing 1 ton rather than 0 tons. At a price of exactly $200, the farmer may be indifferent between 0 tons and 1 ton. At a price of $199.99, the farmer would definitely produce nothing. At a price of $200.01, the farmer would definitely produce 1 ton. The price of $200 is right between, but we assume that the farmer produces 1 ton rather than 0 tons at a price of $200. Rather than flipping a coin to determine how much is produced at a price of $200, we assume that the farmer "does it"; that is, produces the ton of grapes when the price just equals the marginal cost. We indicate this in Figure 6.6 by showing that the quantity supplied is given by the black dot at 1 ton and $200.
Now consider further increases in the price. At prices above $200 up to $300, the firm produces 1 ton because the price received for producing an extra ton is less than the marginal cost of $300. However, at a price of $300, the quantity supplied increases to 2 tons because price just equals the marginal cost of increasing production from 1 to 2 tons. A supply curve is now beginning to take shape. You can complete the curve by continuing to raise the price and watch what happens.
To shorten the story, let us move toward the other end of the scale. Suppose the price of grapes is $1,000. At $1,000, the price is greater than the marginal cost of producing the fourth ton, which is $800, but it is less than the marginal cost of producing the fifth ton, which is $1,200. Suppose that the producer is producing 4 tons of grapes. Would it make sense to produce another ton? No, because increasing production from 4 tons to 5 tons of grapes has a marginal cost of $1,200. The marginal revenue that comes from producing one more ton is $1,000. Because laying out $1,200 and getting back $1,000 is a losing proposition, the farmer would not do it. Production would stay at 4 tons of grapes. If production went up to 5 tons of grapes, profits would go down because the marginal cost of producing the fifth ton is greater than the marginal revenue. Producing 5 tons would not be a profit-maximizing thing to do.
What happens if the price rises to $1,100? At $1,100 the marginal cost is still less than the price so it still makes sense to produce 4 tons. What if the price rises to $1,200? Then at 5 tons, the price just equals the marginal cost and the farmer would produce 5 tons of grapes. When the price rises to the marginal cost at five units, then production increases to five units.
We have traced out the complete individual supply curve for a firm producing grapes using Figure 6.6 with the assumption of profit maximization and the concept of marginal cost.
The Price Equals Marginal Cost Rule
In deriving the supply curve with Figure 6.6, we have discovered the key condition for profit maximization for a firm in a competitive market: the firm will choose its quantity such that price equals marginal cost. You can see that from Figure 6.6. When the price is $800, the firm chooses a level of production for which the marginal cost equals $800 and produces 4 tons.
The supply curve in Figure 6.6 is steplike; it consists of small vertical segments shooting up from the dots. Strictly speaking, it is only at the dots that price equals marginal cost. On the vertical segments above the dots, the price is actually greater than the marginal cost of production, but the price is not great enough to move on to a higher level of production.
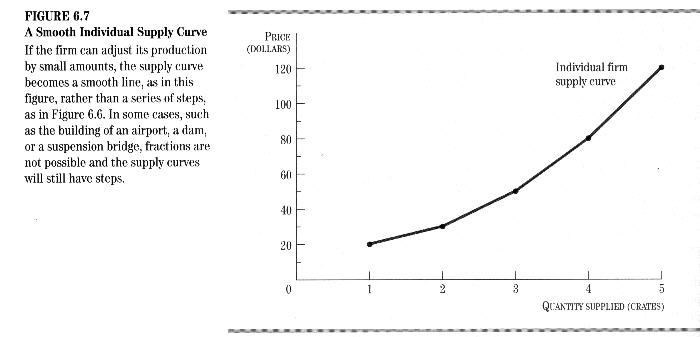
In reality, however, for most products it is possible to divide production into smaller units--half tons, quarter tons, etc. As we do so, the jaggedness of the diagram disappears. If marginal cost between the whole-ton intervals is between the marginal cost at each ton, then the supply curve will be smooth, as shown in Figure 6.7. It is the simple numerical example with production limited to whole-ton amounts that leads to steps in the supply curve. In reality, the diagram consists of a hundred dots rather than five dots. With one hundred dots, the vertical segments would be too small to see and the firm's supply curve would be a smooth line. Price would equal marginal cost at every single point.
The price equals marginal cost rule for a competitive firm is a special case of a more general profit maximization rule that we used, without calling it a rule, in our derivation of the supply curve. This more general rule is that the firm will choose a quantity to produce so that marginal revenue equals marginal cost. This more general rule makes intuitive sense for any profit-maximizing firm, whether it is a competitive firm or a monopoly. If the marginal revenue from producing an additional quantity of output is greater than the marginal cost, then the firm should produce that quantity; by doing so it will increase total revenue by more than it increases total costs, and therefore it will increase profits. On the other hand, if the marginal revenue from an additional quantity is less than the marginal cost, then the firm should not produce that quantity. The firm maximizes profits by choosing the quantity of production for which marginal revenue equals marginal cost.
PRODUCER SURPLUS
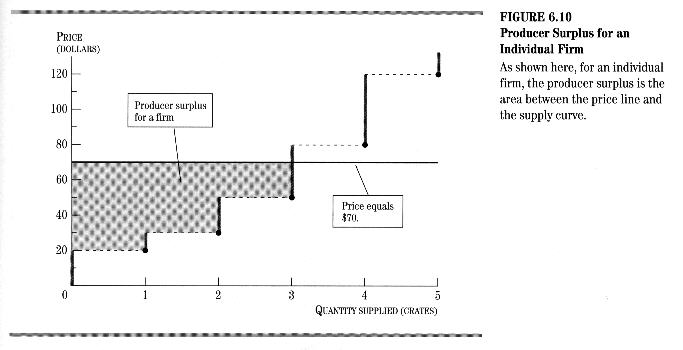
A firm would not produce and sell an item if it could not get a price at least as high as the marginal cost of producing it. The producer surplus is the difference between the marginal cost of an item and the price received for it. For example, your marginal cost (including your opportunity cost) of washing cars on the weekend might be $4 per car. If the car-washing price in your area is $9 per car and this is the price you receive, then your producer surplus would be $5 per car. Or suppose, in the grape example, that the price of grapes is $250. Then the grape producer gets $250 for producing I ton of grapes and incurs $200 in marginal cost. The difference, $50, is the producer surplus. If the price is $350 in the grape example, 2 tons are produced and producer surplus is $150 ($350 - $200) at I ton plus $50 ($350 - $300) at 2 tons for a total of $200 producer surplus.
A Graphical Representation of Producer Surplus
The producer surplus can be represented graphically as the area above the individual firm supply curve and below the price line, as illustrated in Figure 6.10. The producer surplus is analogous to the consumer surplus, the area below the demand curve and above the price line derived in the previous chapter.
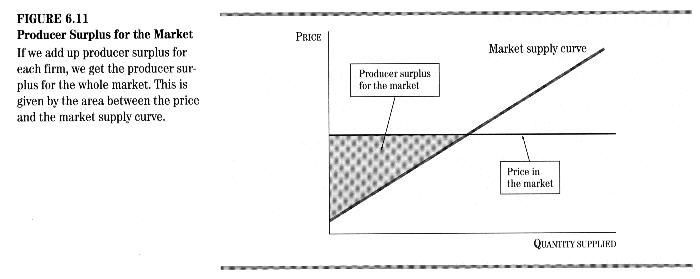
The producer surplus in the whole market can be obtained by adding up the producer surplus for all producers, or by looking at the area above the market supply curve and below the price. This is illustrated in Figure 6.11.
The applications of producer surplus are similar to consumer surplus. Producer surplus provides a measure of how much a producer gains from the market. The sum of producer surplus plus consumer surplus is a comprehensive measure of how well a market economy works, as we will see in the next chapter.