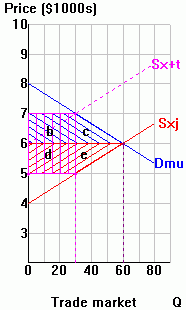
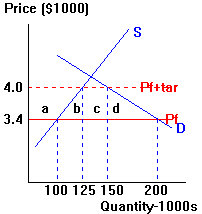
| 1. | Suppose the U.S. is a small country in the global heavyweight motorcycle market. Consider the following about the approximate impact of U.S. tariffs imposed in the 1980s in the heavyweight motorcycle market (quantities are in 1000s): | ||||||||||||||
|
|||||||||||||||
| a. | Contrast the free trade and tariff situation in a domestic-market
supply and demand diagram. See diagram to right |
 |
|||||||||||||
| b. | Use information from the diagram to compute the value of the
following effects of the tariff, and indicate where each one shows up in your diagram: (1)
Change in consumer surplus, (2) Change in producer surplus, (3) Tariff revenue, and (4)
Welfare cost of the tariff. DCS=-abcd=-105M; DPS=+a=+67.5M; DTR=+c=+15M; DNW=-bd=-22.5M (a=67.5M, b=7.5M, c=15M, d=15M) Answer key checklist: Did you calculate the actual numerical values for these effects? Did you use the right units? (millions of dollars) |
||||||||||||||
| c. | An economic study estimated that the tariff
created 700 jobs in the domestic motorcycle industry. How much did each of these jobs
"cost" U.S. consumers? How much did each one cost the economy? cost to consumers: $150,000; cost to economy: $32,143 Answer key checklist: Did you use the right units? (thousands of dollars) |
||||||||||||||
| d. | Suppose that the government had instituted a
quota policy instead. What is the quantity of import licenses that the government would
issue to achieve the same price and quantity effects as the tariff? 25,000: the gap between Qd and Qs with the tariff |
||||||||||||||
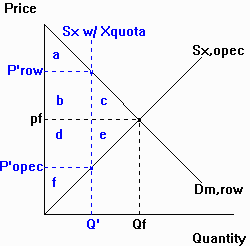
| 2. | a. | Use a domestic-market supply and demand diagram to
illustrate an initial free trade equilibrium for a small country importer of beef. See diagram to the right |
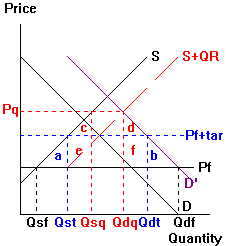 |
| b. | Use your diagram to depict an equivalent tariff and quota on
beef. Tariff at Pf+tar = quota at S+QR. |
||
| c. | Now suppose the demand for beef increases. Depict the
consequences in your diagram. Show that, after the increase in demand, the country's
welfare loss from protection is larger with the quota than with the tariff. Welfare loss from tariff: ab. Welfare loss with quota: abcdef. The quota loss is larger by areas cedf |
||
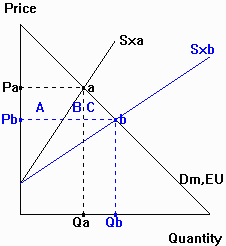
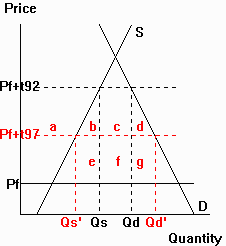
| 3. | Consider China as a small-country importer. From 1992 to
1997, China reduced its (weighted average) tariff rate on imports from 40.9 percent to
28.9 percent. Illustrate the change in China's national welfare from its tariff reduction
in a domestic market diagram for a typical item that China imports. See diagram to the right. DCS = gain = abcd DPS = loss = a DGRev = ? = -c+eg DNW = gain = +bedg dg=benefits in excess of world price on the consumption increase. be=costs in excess of world price on the production decrease. |
 |
| 4. | These questions are based on the course reading, "Japan's change in rice policy could hurt state's exports", (Los Angeles Times, December 18, 1998). | ||
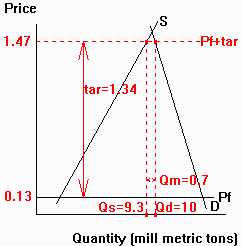
| a. | Illustrate Japan's situation in a Japanese domestic-market
supply and demand diagram for rice. Use values from Passage B
and Passage
C of the article to label (1) the world price of rice, (2) the tariff, (3) the price
of rice in Japan including the tariff, (4) consumption, (5) production, and (6) imports.
For several of these values, provide approximate estimates based on information reported
in the article. See diagram to right (1) Pw=$0.13; (2) tariff=$1.34; (3) Pj=$1.47; (4) Qd=10 mill. tons (5) Qs=9.3; (6) Qm=0.7 |
 |
|
| b. | Consider Passage A
from the article. Do you agree? If so, explain why. If not, then what alternatives are
there? There are many options to "protect rice farmers": tariffs, quotas, VERs and subsidies, for example, are all possible. |
||
| c. | Consider Passage D
from the article. Are government trade restrictions necessary for the reasons given by Ms.
Hanzaki? Why or why not? No prtection is necessary if the situation is that "Foreign rice tastes bad and Japanese rice is the best." If that's the case, consumers will choose Japanese rice even without a tariff. (With respect to the added claim that, "As long as Japan has a rice surplus, there's no need to import any," involves circular reasoning: the "surplus" is likely the result of the government support; without the support, lower prices would boost consumption, reduce domestic production, and boost the demand for imports.) |
||
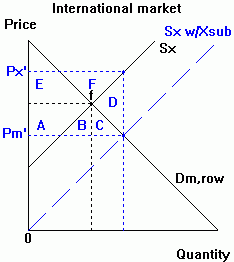
| 5. | Export subsidies: Use a trade-market supply and
demand analysis to illustrate the consequences of an export subsidy implemented by a
large-country exporter. Be sure to indicate the resulting prices buyers pay in the
exporting country and in the importing country. Price importers pay = Pm' Price buyers pay in exporting country = Px' Dnational welfare: Importers: +ABC Exporter: Suppliers: +EF Taxpayers: -ABCDEF Total: -ABCD World: -D |
 |
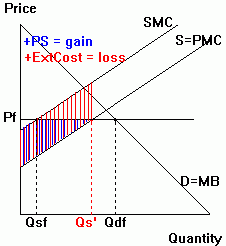
| 6. | The following question draws on information from an article published in the March 10, 2007, edition of the Los Angeles Times, "Ethanol still a long way off in U.S." Assume that the U.S. is a small-country importer of ethanol. You may use diagrams to help you explain your answers, but diagrams are not required. You can receive full credit with careful explanations. | ||||
| a. | According to the article, "Bush
wants Americans to produce and use ethanol, a fuel made from the alcohols
refined from plant material." What policy option(s) would you recommend as
best suited to promote the goals that Bush hopes to achieve? Explain the
reasoning behind your recommendation(s). To increase production: a production subsidy. This directly promotes production by raising the price producers get to Pf + Psub To increase use: a consumption subsidy. This directly promotes consumption by lowering the price consumers pay to Pf - Csub. |
||||
| b. | Which goal do you think is more
worthwhile from a global perspective, more U.S. production or or more U.S. consumption of
ethanol? Why? More US consumption. Extra consumption of ethanol instead of fossil fuels will lower environmental damage. |
 |
|||
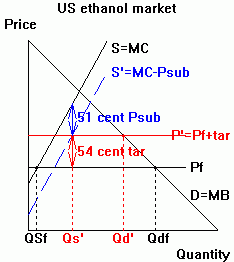
| c. | For each of the following policies described in the article, indicate whether you think the policy promotes what Bush wants Americans to do, and support your answer with a domestic market supply and demand diagram for ethanol. | ||||
| (1) | "The U.S. ... grants ... a subsidy of 51 cents a gallon to companies
that make ... ethanol." Promotes production: yes Promotes use: no; consumption is unchanged |
||||
| (2) | "[T]he U.S. government imposes a
54-cent-a-gallon tariff on ethanol imported from Brazil." Promotes production: yes Promotes use: no; consumption falls |
||||
| 7. | The U.S. is a small-country importer of firearms. Suppose that you are a member of the U.S. International Trade Commission and that you must recommend a policy for the firearms industry. Consider separately each alternative goal below, recommend a "first-best" policy (from the perspective of national welfare) and briefly explain your recommendation (diagrams are optional): | |
| a. | For national security purposes, it is deemed desirable to
increase domestic firearms production by, say, 20 percent (the amount in each case is just
suggestive--don't worry about it). Production subsidy: goal is to raise production; a production subsidy is most direct. |
|
| b. | For national security purposes, it is deemed desirable to
reduce dependency on imported firearms by 20 percent. Trade restriction: a tariff, or even better, a quota, is best here, since a specific physical limit on imports is the target. |
|
| c. | For public safety purposes, it is deemed desirable to
decrease domestic firearms consumption by 20 percent. Consumption tax: goal is reduce consumption; a consumption tax is most direct. |
|
