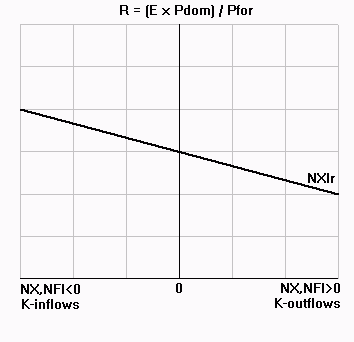
| Works like supply and demand: RH > Ra --> Excess D$ --> $appr back up to Ra Note: a country's trade balance = 0 unless savers
want to shift their savings into or out of the country. |
 |
|
Wednesday, April 18, 2012 |
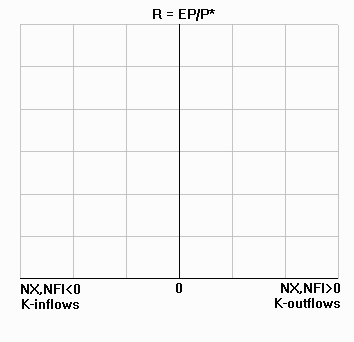
III. Open economy macroeconomics
C. Foreign sector geometry
1. Basic setup
NX-NFI equilibrium is stable
| Works like supply and demand: RH > Ra --> Excess D$ --> $appr back up to Ra Note: a country's trade balance = 0 unless savers
want to shift their savings into or out of the country. |
|
2. The determinants of NFI
Recall the equation for NFI:
| NX | º | Y | - | (C+I+G) | |
| Domestic Output | Domestic
Spending = Absorption (A) |
||||
| net exports | º |
net production which = net foreign investment (NFI) |
|||
The fundamental open economy relationship:
NX º NFI (which = Y - C+I+G)
| NX>0 | <=> | NFI>0 | <--excess production | |
| NX<0 | <=> | NFI<0 | <--excess spending |
NFI consists of 4 components: Y,C,I,G
Based on this relationship, there are exactly 4 things a borrowing country can do to stop borrowing so
much
? What are they?
increase Y, decrease C, I, and/or G
no magic bullet:
must produce more or spend less
lower spending => austerity
part of conditional loan packages (Examples: IMF, EU)
3. Long-run NFI
Hypothetical situation--a steady-state situation.
Abstract from temporary cyclical events, and consider how a country can
be a chronic borrower or lender
Example: Foreign-direct
investment (FDI) falls into this category
a. Characteristics of the long run
| (1) Fully
adjusted output markets (LR S&D elasticities (e)) (2) Y = Yf (full employment) (3) Rsp = Rfwd = RLR (stable ER) (4) rdom = rwld (equal internal and external i-rates) |
 |
b. Net lenders and net borrowers
| NFI = NX
= external balance LR location:
|
 |
|
|
|
| Example 1: China: 2011 CAB = +$281B | ||
| Exports exceed imports by
$281B China invests the surplus in foreign assets |
||
| Example 2: US, 2011: CAB = -$600B | ||
| Imports exceed exports by
$600B Foreign countries invest this amount in US assets |
||
c. Providing a favorable investment climate
Recall:
Macroeconomic goal: to provide an environment that promotes
investment and growth
A big part of that is good
governance
Source:
Worldwide
governance indicators
6 indicators tracked by World Bank
Governance
Indicators: Country data (select "Country" for time series back
to 1996)
The indicators (see definitions for details):
Investment and growth
(1) NBER, Bekaert, Geert, and Campbell R. Harvey,
Spring 2001
Financial liberalization
g ir,
hI, hgrowth
Samples of 30 and 95 countries: the most likely estimated range for the
resulting increase in annual growth = 1.5-2.3%
Why?
More overall savings and financial investment (including portfolio
diversification by locals)
More efficient financial sector (insider trading laws,
transparency, etc.)
"It is not just the existence of capital markets that is important for growth prospects--it is crucial that these capital markets be liberalized to allow foreign investors to participate and local investors to diversify their portfolios across borders. Our research shows that the financial liberalization effect is not subsumed by economic reforms or proxies for the development of capital markets and financial intermediation."
(2) NBER 8084: Robert Lipsey,
June 2001: FDI vs portfolio investments
FDI more likely to ride out crises: 1982, 1994, 1997
1982: FDI fell to only 40% of 1982 level, but did not turn negative
1994: FDI fell 15%, and exceeded 1994 level by 1997-98, while portfolio
investments turned negative and recovered only slightly
1998: FDI fell slightly and recovered by 1999
Why? Subsidiaries can survive downturns by turning to exports