| Resulting time path for R This offers economists' best explanation of the cyclical behavior of ERs: PPP accounts for why ER changes tend to be neutral in the long run. IPC accounts for why ERs tend to deviate from their PPP levels in the short run. |
 |
|
Monday, April 16, 2012 |
IV. Stabilization policy
B. Foreign exchange markets
3. Exchange rate determination
b. The asset market approach to ER changes
Results of interest arbitrage:
| 7/15/2007 | Rate of return for US savers from interest arbitrage | ||
| Country | Annual i-rate on 3-month government bonds | Covered | Uncovered |
| US | 4.940% | 4.94% | 4.94% |
| Britain | 5.820% | 5.24% | 5.40% |
| Canada | 4.510% | 5.20% | 32.83% |
| Japan | 0.700% | 5.40% | 18.93% |
| Range | 5.120% | 0.44% | 27.89% |
Implication for basic monetary theory:
Closed economy: Fed, by
regulating bank reserves, controls quantity of credit available to the economy, and
therefore i-rates.
Open economy with mobile financial assets: Eurocurrency market has largely taken control of i-rates away from Fed.
Monetary policy now mainly affects ERs
Perfect interest parity is not met in practice
because of:
--Transaction costs
--Controls on asset mobility
Systematically the case that foreign asset transactions are more
profitable than domestic ones. Unclear if traders simply can't learn to predict well, or
if traders insist on a risk premium.
For our purposes, reasonable to assume perfectly mobile financial assets
c. Combining PPP and IPC
PPP => %DEPPP
= %DPfor
- %DPdom
ER changes
offset differences in inflation to equalize goods and services prices across
countries
IPC => %DEIPC
= ifor
- idom
ER changes
offset differences in interest rates to equalize rates of returns across
countries
It turns out we can fit the PPP model into the IPC model:
Recall from macroeconomics:
What does
the real interest rate (r)
mean?
inflation-adjusted
r = i - %DP
=>
i = r + %DP
| %DEIPC | = | ifor | - | idom | |
| = | (rfor + %DPfor) | - | (rdom + %DPdom) | ||
| %DE | = | (%DPfor - %DPdom) | + | (rfor - rdom) |
|
%DR |
= |
%DE | - | (%DPfor - %DPdom) |
= |
(rfor - rdom) | |
| 1: PPP | 2: real-i IPC |
1: PPP: stabilizes the real
exchange rate when inflation rates differ
2: real IPC: destabilizes the real exchange rate when real
interest rates differ
What makes currencies get undervalued or
overvalued?
Lowering your real i-rate -->
K-outflows --> real depreciation, making the currency undervalued
Raising your real i-rate --> K-inflows --> real appreciation, making
the currency overvalued
See Combining PPP and the IPC handout
| Resulting time path for R This offers economists' best explanation of the cyclical behavior of ERs: PPP accounts for why ER changes tend to be neutral in the long run. IPC accounts for why ERs tend to deviate from their PPP levels in the short run. |
|
C. Foreign sector geometry
We've now set the table for analysis of international
investment
1. international transactions: CA and foreign financial
assets
2. ERs and the key role of the real ER (R) vs. the nominal
rate (E)
Goal now: turn to how international investment actually plays out in an open economy
Key assumptions:
--Financial assets are freely mobile internationally
--The economy is too small to affect global interest rates
--Many traded products are imperfect substitutes for each other
--Floating exchange rates
1. Basic setup
Notation:
NX = net exports
(approximately = CAB)
NFI = net foreign investment
Recall from international transactions--these are always the same size.
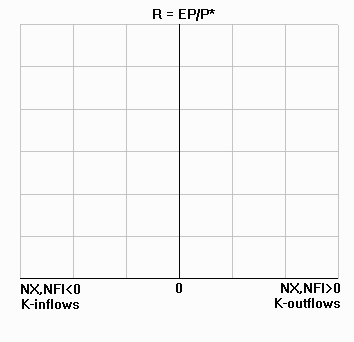
NX º NFI --gives us 2 curves to draw
Horizontal axis: NX and NFI values
Vertical axis: R
Simplified notation: NX and CAB assumed to mean the same thing
| Curve (1) NX ? What direction will it slope? |
 |
Note: With floating ERs, if foreign
investments don't occur, NX always = 0.
countries would use exports to pay for
imports, just as we assumed back in the trade part of the course
Curve (2) NFI
| Slope: ? All else equal, suppose R suddenly rises, making the currency overvalued--how would you expect savers to respond? NFI slopes up because of reactions by savers to unexpected ER fluctuations. (based on the IPC) Unexpected +R => Overvalued ER--> capital outflows Unexpected -R => Undervalued ER --> capital inflows |
|