|
March 05, 2012 |
IV. The
overall results of
globalization
B. Empirical FAQs
Q1:
What has been the relationship between globalization and growth?
Countries that are so small
that they must have open economies often prosper.
None of the 10 countries with per
capita income higher than US has a population above 10M; 6 are below 1M.
Leichtenstein (37K)
Qatar (848K)
Luxembourg (509K)
Bermuda (69K)
Singapore (5,353K)
Jersey (95K)
Norway (4,707K)
Brunei (409K)
Hong Kong (7,153K)
United Arab Emirates (5,314K)
2 of the 4 Asian Tigers were small: Singapore (5.4M) and Hong Kong
(7.1M)
3 richest countries in sub-Saharan Africa: Botswana (2.1M,
$16,300), Gabon (1.6M,
$16,000), Mauritius (1.3M, $15,000), all higher than
the world average.
Empirical findings from large sample studies
Handout:
Globalization and growth: class sample
| Annual growth rates since 1980 | |||
| Export volume | Real output per capita | ||
| 1 | Industrial countries | 3.1% | 1.6% |
| 2 | Asian Tigers plus Chile | 7.2% | 3.7% |
| 3 | High export-growth LDCs (above median) | 9.5% | 3.8% |
| 4 | Low export-growth LDCs (below median) | 2.5% | 0.7% |
Note:
"Association is not
causation"
There is still debate about whether
globalization fosters growth or just accompanies growth
Weak to nonexistent evidence that
lowering import barriers is the driver (see Dollar and Kraay vs. Rodrik)
Appears to be more important to
market your output to global buyers (exports) than to open up to imports
But it is
nonetheless the case that we lack a good example of an LDC that has grown
rapidly without rapidly increasing its exports (i.e., increasing its
globalization)
Counterexamples: North Korea, Burma, Eritrea.
Q2: What has been the relationship between globalization and the level and distribution of income?
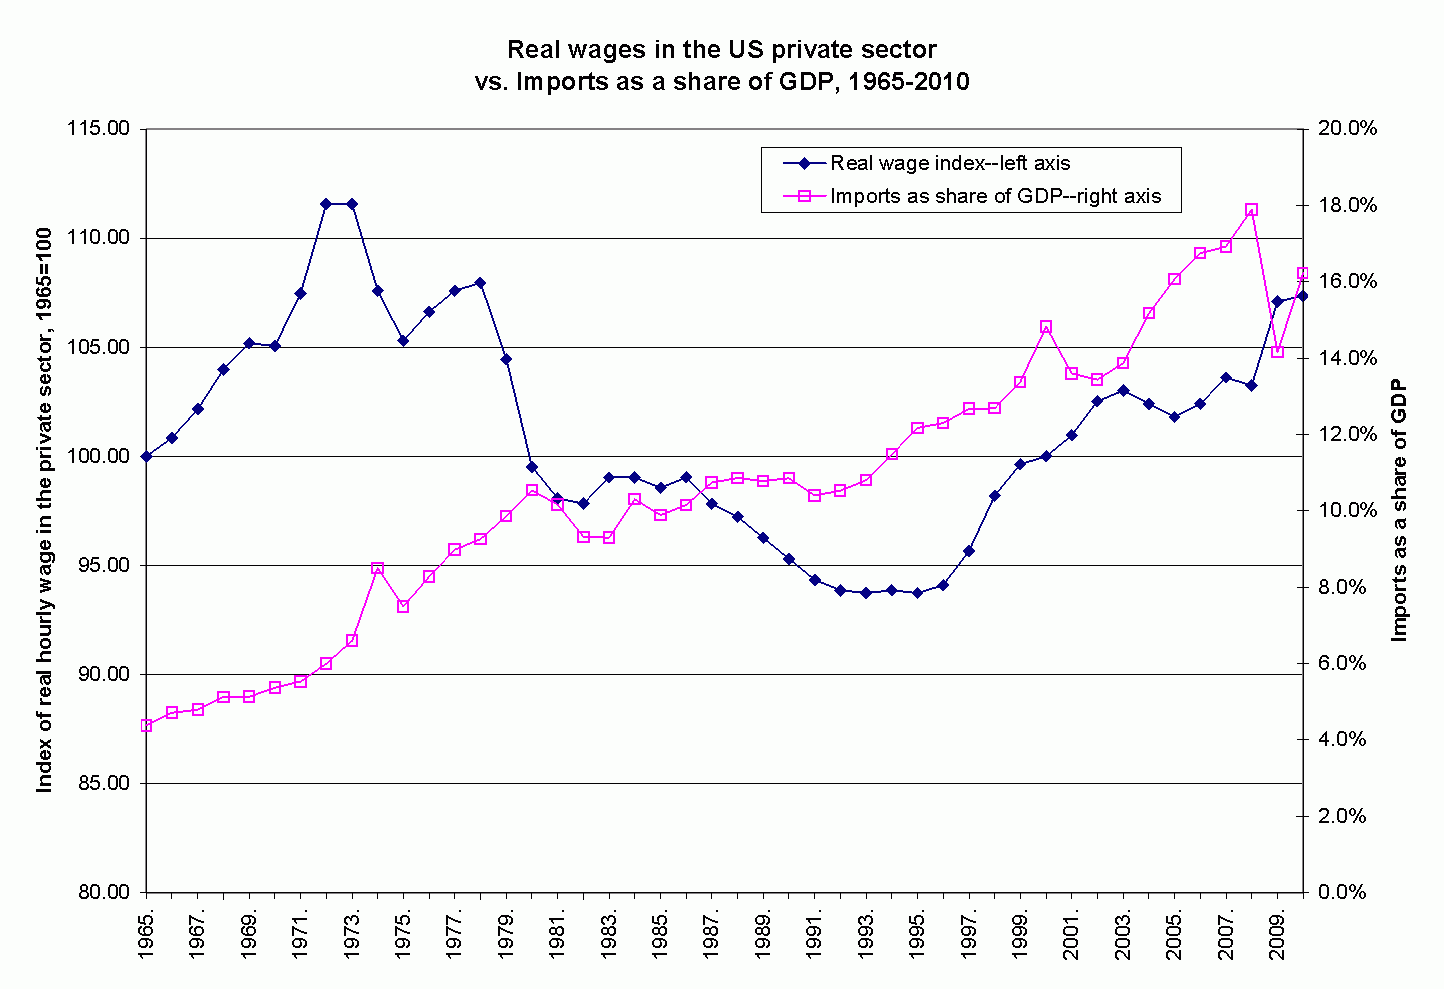
US: Real wages in the
U.S.
handout
Real wages in the U.S. are about 10% lower
today than their peak in the 1970s.
 |
Estimates of the decline in US wages from the 1970s to the 1990s
attributable to globalization range from 15-50%
The most important factor is
technology: labor-saving production techniques and a shift of tastes to
high-tech goods which are skill-intensive.
Any production shift away from L-intensive products, no
matter what the reason, has SS theorem effects.
For the past 20 years, the trend in real
wages has reversed, despite continuing increases in import penetration, and the
link has never been particularly consistent.
LDCs: varies from country to country
Note 1: Wages and technology: similar effects everywhere
Note 2: Nonwage components of well being:
(1) child labor If wages rise with trade, will that increase child labor in LDCs?
Why might it rise? child labor is more profitable
Why might it fall? families can get along with less child labor
"Does globalization increase child labor?
Evidence from Vietnam." NBER8760 (2002), Eric Edwards and Nina Pavcnik.
1993: Vietnam lifted export rice restrictions
1993-98: Rice exports doubled and price rose 30%
Child labor fell by 9% (2.2M), 1M due to the
change in rice export policy
Dramatic increase in school attendance of 14-15
year-old girls
(2) life expectancy
longer lifespan, like higher incomes,
can also raise lifetime consumption
(3) absolute poverty
| Percentage of global population experiencing absolute poverty: | 1970 | 2006 |
| $1 per day poverty rate | 26.8% | 5.4% |
| $2 per day poverty rate | 45.2% | 5.4% |
| Number of poor | 403 million | 152 million |
|
|
||
| Regional $1 per day poverty rates | 1970 | 2006 |
| Africa, Sub-Sahara | 39.9% | 31.8% |
| Middle East & North Africa | 8.4% | 5.2% |
| East Asia | 58.8% | 1.7% |
| South Asia | 20.1% | 2.6% |
| Latin America | 11.6% | 3.1%0 |
(4) Relative income
distribution
Global Gini coefficient: 1970: 67.6 /
2006: 61.2