Trade for a small country: Domestic-market supply and demand geometry:
Results
For a small country, the consequences of trade can be
illustrated in a standard supply and demand diagram. For example, consider the U.S.
domestic market for barley.
The domestic market has the usual supply and demand curves for barley,
as illustrated in the diagrams below.
For a small country, the world price (Pw) remains the same, no matter
how much the country buys or sells on the world market. So, once we find out the world
price, we just plot it as a horizontal line in the domestic-market supply and demand
diagram and then work out the consequences.
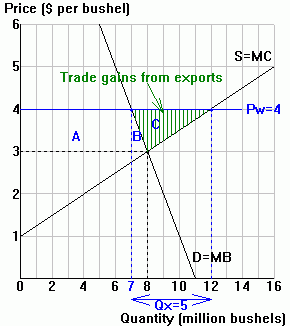
The lefthand panel below shows the consequences of trade for the U.S.
when the world price of barley is $4 per bushel.
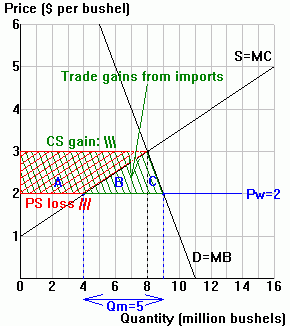
To do: In the righthand panel, depict
the consequences if the price of barley is $2 per bushel on the world market.
| Case 1: Pw = $4 per bushel |
Case 2: Pw = $2 per bushel |
 |
 |
| Results of free trade |
Results of free trade |
Quantities
(mill.bushels) |
Change in welfare ($M) |
Quantities
(mill.bushels) |
Change in welfare ($M) |
| |
Area |
Amt. |
|
Area |
Amt. |
| Qs |
12 |
DConsumer surplus: |
-AB |
-7.5 |
Qs |
4 |
DConsumer surplus
(\\\): |
+ABC |
+8.5 |
| Qd |
7 |
DProducer surplus: |
+ABC |
+10 |
Qd |
9 |
DProducer surplus
(///): |
-A |
-6.0 |
| Qx |
5 |
DNational welfare: |
+C |
+2.5 |
Qm |
5 |
DNational welfare: |
+BC |
+2.5 |

