3.
How do you know?
|
Wednesday, March 27, 2013 |
Exam 2: Study Questions
III. Theory of the firm: production and costs
| 1. | Consider the production function Q = 25 L1/2K1. | |
| a. | Does the production function exhibit increasing, decreasing, or constant returns to scale? How can you tell? | |
| b. | If the price of labor is $80 and the price of capital is $40, what capital-labor ratio will the firm choose to minimize its production costs? | |
| 2. | A firm produces its output according
to the following Cobb-Douglas production function: Q = 10ĚL2/3 K1/3 where Q = output, K = quantity of capital, L = quantity of labor. For each of the following answers, be sure to show your work and/or explain how you decided. |
|
| a. | What kind of returns to scale characterizes the firm's production? | |
| b. | If the firm increases its usage of labor by 60 percent, by what approximately percentage will its output increase? | |
| c. | The firm currently uses 8L and 1K to produce 40 units of output. If PK=$200, what value of PL would make this input combination cost-minimizing? | |
|
3. |
A firm currently uses two inputs, 5 units of skilled labor (Ls) and 40 units of unskilled labor (Lu), to produce its output. Input prices equal $100 per hour for skilled labor and $10 per hour for unskilled labor. The firm's current input combination is cost-minimizing. | ||
| a. | The firm's total cost (TC)=_________ (Show your work.) | ||
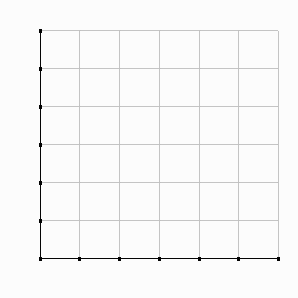
| b. | Use the axes to the right to illustrate the firm's present situation in an isoquant/isocost diagram. Put skilled labor (Ls) on the x-axis. Use numerical values to label the isocost endpoints and the current input combination. |
 |
|
| c. | The firm's MRTS=_________ How do you know? |
||
| d. | Suppose that the wage for skilled workers falls to $50 per hour. If the firm wants to continue to produce the same level of output, what input adjustment should the firm make? Explain why, and illustrate the firm's new optimum (you won't be able to provide numerical values for the new optimum). | ||
|
4. |
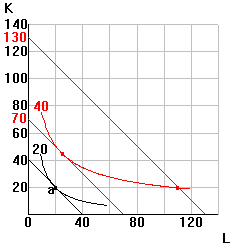
The firm illustrated in the diagram below uses labor and capital to produce its output. Initially, the firm is operating at point "a" in the diagram. | |||
| a. | Draw each of the following output expansion paths (OEP) for the firm: |
 |
||
| (1) | its short-run OEP when the firm can vary labor but not capital. | |||
| (2) | its long-run OEP when the firm can vary both labor and capital. | |||
| (3) | its OEP if the firm increases its scale of production (maintaining a constant capital-labor ratio). | |||
| b. | Suppose that labor and capital each cost $10 per unit. Compute each of the following: | |||
| (1) | the long-run average total cost of producing 20 units of output. | |||
| (2) | the short-run average total cost of producing 40 units of output. | |||
| (3) | the long-run average total cost of producing 40 units of
output.
|
|||
| 5. | A firm currently uses 40 units of labor (L) and 20 units of capital (K) to produce 400 units of output. Input prices equal $30 for labor and $60 for capital, while the marginal products are 6 for labor and 3 for capital. | |
| a. | To minimize the cost of producing its current level of output, should the firm use more L and less K, more K and less L, or leave its input combination unchanged? Explain your answer. | |
| b. | Illustrate the firm's present situation in an isoquant/isocost diagram. | |
| c. | Suppose that the firm sells its output in a perfectly competitive market for a price of $6 and that its capital stock is fixed in the short run. To maximize its short-run profits, should the firm increase output, decrease output, leave output unchanged or change output in an uncertain direction? Support your answer. | |
IV. The perfectly competitive market
| 1. | A perfectly competitive firm has the following AVC schedule in the short run: | ||||||||||||||||
|
|||||||||||||||||
| a. | Complete the MC row of the table. | ||||||||||||||||
| b. | If the firm sells its output for $10 per unit, how many units should it produce? Explain briefly. | ||||||||||||||||
| 2. | Illustrate a situation in which a perfectly competitive firm faces a price less than its minimum average variable cost. Use your diagram to contrast the firm's profits/losses if it (1) continues to operate or (2) shuts down. |
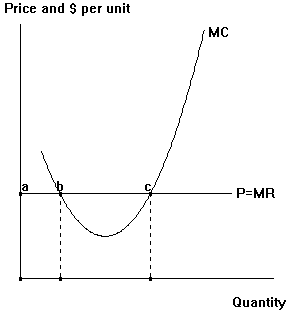
| 3. | The diagram to the right depicts a particular short-run situation of price (P), marginal revenue (MR) and marginal cost (MC) for a perfectly competitive firm. |
 |
|
| a. | Add conventional (U-shaped) average variable cost (AVC) and average total cost (ATC) curves to the diagram. Draw them so they both lie entirely above the P=MR line. | ||
| b. | Given the firm's present situation, rank the output levels corresponding to points a, b, anc c in the diagram from most profitable to least profitable. Do this by labeling the output levels along the horizontal axis with 'Q1' for most profitable, 'Q2' for second-most profitable, and 'Q3' for least profitable. | ||
| c. | In your diagram, use the notation 'A' to indicate the area which shows how much more profitable Q2 is than Q3, 'B' to indicate the area which shows how much more profitable Q1 is than Q2, and 'C' to indicate the area which shows the firm's overall profits/losses if it chooses Q1. | ||
| d. | Assuming this firm's cost curves remain stable, indicate in your diagram the lowest price this firm will need to receive in order to remain in the industry in the long run. | ||
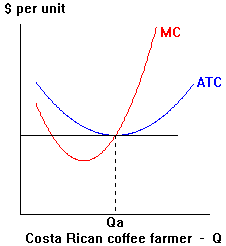
| 4. | In the diagrams to the right, the lefthand panel illustrates the international coffee market, which is assumed to be a perfectly competitive, constant cost industry. The righthand panel illustrates the cost curves of a single coffee farmer in Costa Rica. (Since variable costs are low at small output levels, the AVC curve is unnecessary and has been omitted.) The initial situation is the long-run equilibrium prevailing at the end of World War II. | 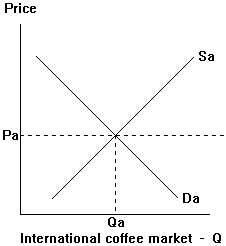 |
 |
|
|
Depict each of the following events in the market diagram and show the impact of each event on the Costa Rican coffee farmer. Be sure to indicate the farmer's output level and economic profits in each case: |
||||
| a. | Between 1945 and 1950, world coffee demand rebounded from the depressed levels caused by European shipping blockades during World War II. Illustrate the new short-run equilibrium. | |||
| b. | Demand then stabilized, but its initial surge caused entry into the coffee industry. However, coffee trees take several years to mature. By the time they began producing, too much entry had occurred and throughout the 1960s, the world price of coffee was below its long run level. Illustrate the situation as it stood in the 1960s. | |||
| c. | The coffee market reached its new long-run equilibrium level in the 1970s after a coffee frost destroyed many coffee trees in Brazil. Illustrate the final long-run equilibrium. | |||
| 5. | The diagrams to the right depict a short-run equilibrium in a perfectly competitive market in a constant cost industry. |
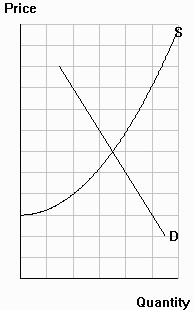 Industry |
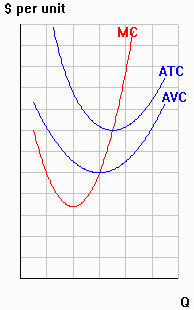 Firm |
|
| a. | Illustrate the current output and profits for the
firm. Should the firm operate or shut down? How did you decide?
|
|||
| b. | Now illustrate in your diagrams how the industry will adjust from its current short-run equilibrium to a long-run equilibrium. Be sure to label the long-run price, industry output, and firm output. | |||
|
6. |
Electricity during periods of high ("peak") demand is often provided by so-called "peaker" plants. Peakers are typically run by gas-fired turbines, similar to jet engines. Because of their relatively high costs, peakers are profitable to operate only during periods of high demand. At off-peak times they are shut down. Consider a perfectly competitive firm which owns a peaker plant in California's electricity market. | |||
|
a. |
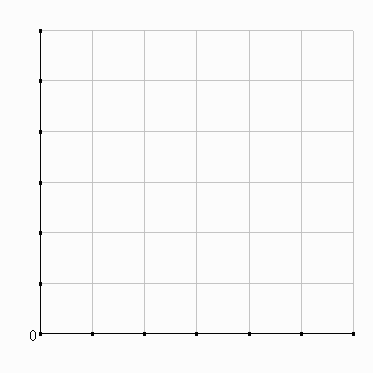
In the diagram to the right, sketch conventional U-shaped MC, ATC and AVC curves for the peaker plant. |
 |
||
| b. | Illustrate the firm's profits when it operates during high-priced peak periods. | |||
| c. | Now illustrate its situation during low-priced off-peak periods when the firm shuts down. | |||
|
(1) |
Indicate in your diagram the area which shows how much the firm saves by shutting down instead of operating. What accounts for the firm's savings? | |||
|
(2) |
Indicate the area which shows how much the firm loses even though it shuts down. What accounts for the firm's losses while it is shut down? | |||
|
7. |
Consider the
following information based on a lawsuit decided in 1985: (1) Carbo makes a powder that is used in the production of steel. (2) Carbo signed a three-year contract with L&R Company in which it agreed to pay L&R $600,000 to bag 20,000 tons of its powder. (3) The contract specified that L&R would buy a special bagging machine that cost $100,000 and would have no salvage value at the end of the contract. (4) Both sides expected that the variable costs per ton for bagging the powder would be constant and would total $300,000 for the contracted quantity of 20,000 tons. |
||||
|
a. |
In the diagram to the right, sketch the following curves for L&R Company.: | Price per ton |
 Q (1000s of tons) |
||
|
(1) |
price (P) per ton -- label the value as well | ||||
|
(2) |
marginal cost (MC) -- label the value as well | ||||
|
(3) |
average total cost (ATC) -- label the value at the contracted output level of 20,000 tons | ||||
| b. | Under the contract, how much profit did L&R
expect to earn? Shade in that area in your diagram.
|
||||
| Because of a drop in demand for steel after the contract was signed, Carbo ended up shipping only 50% of the powder (10,000 tons) for L&R to bag and paid only $300,000 to L&R by the end of the three-year contract. L&R sued Carbo for a breach of contract. Under U.S. contract law, a victim of breach of contract is allowed to collect damages sufficient to make the victim as well off as if the contract had been fulfilled. L&R requested damages equal to the unpaid balance of $300,000. Carbo agreed that it had breached the contract but argued that $300,000 in damages was too high because it would leave L&R better off than if the original contract had been fulfilled. | |||||
| c. | If you were the judge in this case, how much would you have awarded in damages? How did you decide? | ||||
V. General equilibrium with competitive markets
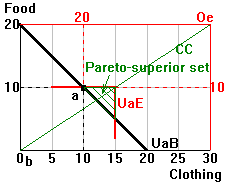
| 1. | In the diagram to the right, Bert regards food
and clothing as perfect 1-for-1 substitutes, while Ernie regards them as
perfect complements, always wanting to consume 3 units of clothing for every
2 units of food. At their initial allocation of clothing and food, who values clothing more highly relative to food, Bert or Ernie? Support your answer. |
 |
|
| 2. | Every Easter, Grannie Annie gives Easter baskets to her granddaughters, Kelly (K) and Erin (E). The baskets contain small chocolate eggs (C) and jelly beans (J). Kelly and Erin like both types of candy, but compared to Erin, Kelly has a greater preference for chocolate eggs relative to jelly beans. Grannie Annie knows this, so she gives Kelly 20 chocolate eggs and 10 jelly beans and gives Erin 10 chocolate eggs and 20 jelly beans. This distribution of candy turns out to be Pareto optimal. | ||
|
a. |
In the diagram to the right, draw an Edgeworth box for the candy received by Kelly and Erin. Put chocolate eggs on the horizontal axis. and use the lower lefthand origin for Kelly. Indicate the distribution of candy between the two children, and label the quantities involved. Draw clearly labeled indifference curves through the distribution point. |
 |
|
| b. | Given Kelly and Erin's consumption bundles, which child, if
either, places the higher valuation on additional chocolate eggs relative to jelly beans?
How can you tell this from your diagram?
|
||
| c. | Suppose that last Easter, Grannie Annie mistakenly reversed the names on the two Easter baskets, leaving both Kelly and Erin worse off than usual. In the same Edgeworth Box you drew for part a, draw carefully labeled indifference curves through the resulting distribution of candy. | ||
| d. | Given their new consumption bundles, which child places the higher valuation on additional chocolate eggs relative to jelly beans? Clearly indicate how the different valuations show up in your diagram. | ||
| 3. | Cristina is a typical consumer in Argentina and Michelle is a typical consumer in Chile. They both eat beef and grapes. Both countries grow grapes successfully, and Cristina and Michelle each have an endowment of 100 pounds of grapes. Argentina produces much more beef, so Cristina has an endowment of 300 pounds of beef while Michelle has only 100 pounds of beef. | ||
|
a. |
In the diagram to the right, draw an Edgeworth box that depicts and labels the initial endowments of beef and grapes for Cristina and Michelle. Put beef on the horizontal axis, and use the lower left-hand origin for Cristina. |
 |
|
| b. | Cristina and Michelle have the same preferences for beef and grapes, so if they pay the same prices, they like to consume beef and grapes in the same proportion as each other. Add a contract curve to your diagram. | ||
| c. | Add a typical-looking indifference curve for each consumer that passes through their initial endowment point. | ||
| d. | Do Cristina and Michelle place the same relative value on extra beef? How did you decide? | ||
| e. | Do you find your answer to part d surprising given that they have the same preferences for beef and grapes? Why or why not? | ||
| f. | Suppose that Argentina and Chile open themselves to free trade with each other. Illustrate what a Pareto optimal allocation of beef and grapes that Cristina and Michelle might agree to would look like. Are you surprised by the direction of trade that you've illustrated? Why or why not? | ||
| 4. | Consider the following information about the trucking industries of Mexico and the U.S.: |
|||||||||||
|
||||||||||||
| a. | Suppose that under Nafta the trucking companies of the U.S. and Mexico are granted unlimited access to each other's roads. A U.S. trucking company then merges with a Mexican trucking company to form a single firm. In the diagram to the right, draw an Edgeworth Box to illustrate the inital allocation of labor and capital between the two branches of the firm. Put labor on the horizontal axis. |
 |
||||||||||
| b. | Use values from the table above to label the numerical values of the slopes of your isoquants at the initial allocation you illustrated in part a. | |||||||||||
| c. | What input reallocation would you recommend to
improve the firm's efficiency after the merger? Illustrate how your reallocation could
achieve efficiency for the firm.
|
|||||||||||
| d. | What type of inefficiency, if any, is illustrated in this case? How did you decide? | |||||||||||
| 5. | Suppose that Santa Monica's total labor and capital are allocated between two groups of firms: (1) coastal firms (C) and (2) inland firms (I). Both groups of firms use labor and capital to produce their output, and both groups pay the same price for capital (PK). |
||
| a. | Suppose that initially, both coastal firms (C) and inland firms (I) also pay the same wage for labor (PL). In the diagram below, draw an Edgeworth Box to illustrate the initial allocation of Santa Monica's total labor and capital between the two groups of firms. Put labor on the horizontal axis, and put coastal firms at the lower left origin of your box. | ||
| b. | Use the notation "A" to label the initial allocation, and illustrate the initial MRTS and PL/PK. |
 |
|
| c. | Now suppose that Santa Monica passes legislation that requires coastal firms to pay their employees a higher "living wage" of $12.25 per hour. Inland firms are exempt from the requirement. What sort of efficiency condition is most clearly affected by this legislation? Explain briefly. | ||
| d. | Illustrate in your diagram the impact of the legislation. Assume that the total output of inland firms is unaffected by the legislation. | ||
| e. | In your Edgeworth Box diagram, use the notation "B" to label the new allocation of labor and capital, and illustrate the new MRTS and PL/PK for the two groups of firms. What has happened to the amount of labor employed by (1) coastal firms and (2) inland firms? | ||
|
f. |
Suppose that the price of capital (PK) is unaffected by the legislation. (1) How has the legislation affected the price of labor (PL) for (a) coastal firms and (b) inland firms? (2) How do these labor-price outcomes show up in your diagram? (3) Are the labor-price outcomes related to each other? Why or why not? |
g. |
In the diagram below, sketch a production possibilities frontier (PPF). Put output from coastal firms (C) on the horizontal axis. Label where the output levels from allocations A and B might logically be located on your PPF. | |
 |
||||
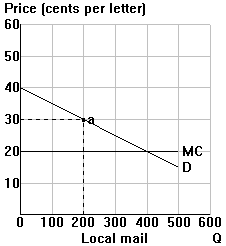
| 6. | The citizens of Nearandfar consume two constant-cost products: long-distance mail and local mail. The economy currently produces 300 long-distance letters and 200 local letters. Information concerning prices and costs appear in the figures to the right. | 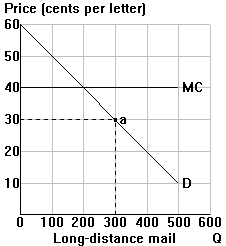 |
 |
|
| a. | Sketch a production possibilities frontier for Nearandfar which accurately reflects the cost situation shown in the diagrams above. Put long-distance mail on the horizontal axis, and label Nearandfar's current production point. | |||
| b. | Contrast Nearandfar's MRS and MRT. What type of inefficiency applies to the economy of Nearandfar? | |||
| c. | To reach a Pareto optimum, should Nearandfar produce more long-distance mail and less local mail, or less long-distance mail and more local mail? Explain briefly. | |||
| 7. | a. | What do economists mean when they say that a particular allocation of resources is "Pareto optimal"? | |
| b. | Label each of the following as "efficient" or "inefficient." If "efficient," explain why. If "inefficient," indicate the efficiency condition which is most clearly violated, and briefly describe why the resulting situation is wasteful. | ||
| (1) | When airlines were regulated, military personnel were charged lower airfares than civilians. | ||
| (2) | Baseball teams are more likely to offer discounts on ticket prices for weekday games when there tend to be many empty seats than for their more popular nightgames, which often sell out. | ||
| (3) | Government subsidies keep the price of water lower for farmers than for firms in other industries such as mining and manufacturing. | ||
|
Use an Edgeworth box diagram to illustrate part a(1). Put airline tickets (A) on the horizontal axis and other goods (G) on the vertical axis. |
|||
Cross-topic questions:
| 1. | Please answer each of the following: | |
| a. | What is the difference between the marginal rate of substitution (MRS) and the marginal rate of technical substitution (MRTS)? | |
| b. | True or false, and explain: A firm which is earning zero accounting profit should consider exiting from the industry. | |
| c. | True or false, and explain: A perfectly competitive firm would never find that its profit-maximizing output level lies in the region of increasing marginal returns. | |
| d. | Suppose Bonnie and Clyde find that their prison allocation of bread and water (allocation A) does not satisfy exchange efficiency. True or false, and explain: All Pareto optimal allocations of the available bread and water would be Pareto superior to allocation A. | |