| Name: ______________________________ | Exam number: _________ |
Exam 2: Spring 2010
Greetings.
Please answer each of the exam questions as well as you can. Keep in mind that you can get partial credit for partial answers.
To receive credit for numerical answers, you must show appropriate computations. If you use a calculator, at least indicate what key formulas you used.
Points are distributed in proportion to the number of minutes recommended for each question. The recommended minutes sum to 50.
You may use page 1 (this page) as a scratch sheet, but I remove the page before grading the exam, so do not use page 1 for anything you want to me grade.
Good luck!
|
1. |
(6 minutes) Consider the production function Q = 25ĚKL1/2 (or Q = 25ĚK1L1/2). | |
| a. | Does the production function exhibit increasing, decreasing,
or constant returns to scale? How can you tell?
|
|
| b. | If the price of labor is $80 and the price of capital is $40,
what capital-labor ratio will the firm choose to minimize its production costs?
|
|
|
2. |
(16 minutes) Consider the following information
about a firm in a perfectly competitive industry which uses labor (L) and capital (K) to
produce its output: Production function: Q = 50ĚL1/2ĚK PL = $100, PK = $200, and price of output (P) = $4. In the short run, the firm's capital is fixed at K=4. Labor is variable. For each of the following answers, be sure to show your work and/or explain how you decided. |
||
| a. | Derive the formula for the firm's (1) MPL and (2) short-run (MC) as a function of PL and MPL.
|
||
| b. | Determine the firm's short-run
profit-maximizing quantity of (1) labor (L*) and (2) output (Q*).
|
||
| c. | Is the firm producing its short-run output with a
cost-minimizing combination of labor and capital? If so, explain why. If not, explain why
not, and indicate which direction the firm should adjust its inputs to reduce its costs in
the long run.
|
||
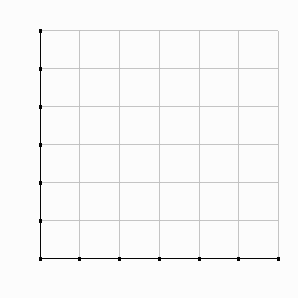
| d. | In the diagram to the right, sketch the firm's
current isoquant-isocost situation. Use numerical values to label the endpoints of the
firm's isocost line, the firm's current input combination, the firm's isoquant, and the
firm's MRTS
|
 |
|
|
3. |
(8 minutes) Fill in the answer boxes for each of the following two problems: | |
| a. | 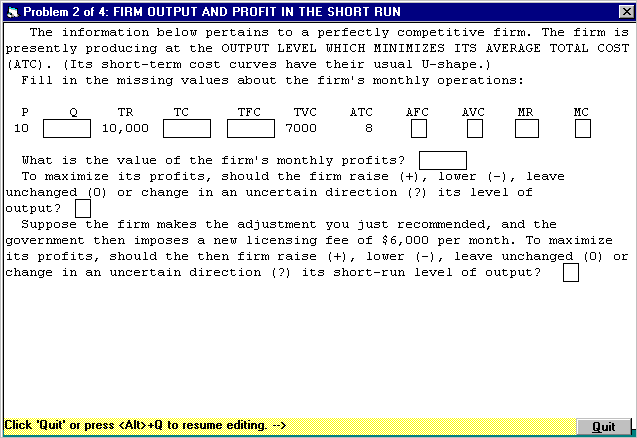 |
|
| b. | 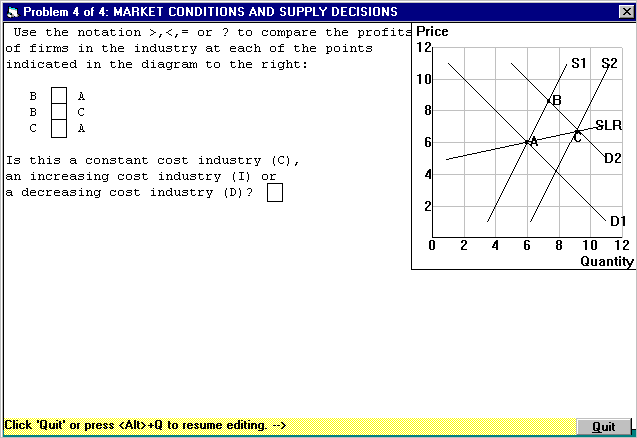 |
|
|
4. |
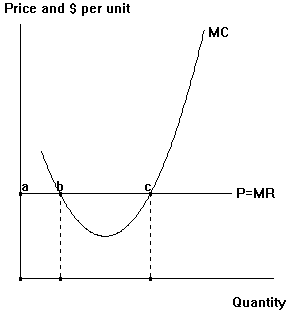
(8 minutes) The diagram below depicts a particular short-run situation of price (P), marginal revenue (MR) and marginal cost (MC) for a perfectly competitive firm. | |
 |
||
| a. | Add conventional (U-shaped) average variable cost (AVC) and average total cost (ATC) curves to the diagram. Draw them so they both lie entirely above the P=MR line. | |
| b. | Given the firm's present situation, rank the output levels corresponding to points a, b, and c in the diagram from most profitable to least profitable. Do this by labeling the output levels along the horizontal axis with 'Q1' for most profitable, 'Q2' for second-most profitable, and 'Q3' for least profitable. | |
| c. | In your diagram, use the notation (1) 'A' to indicate the area which shows how much more profitable Q2 is than Q3, (2) 'B' to indicate the area which shows how much more profitable Q1 is than Q2, and (3) 'C' to indicate the area which shows the firm's overall profits/losses if it chooses Q1. |
|
| d. | Assuming this firm's cost curves remain stable, indicate in your diagram the lowest price this firm will need to receive in order to remain in the industry in the long run. | |
| 5. | (12 minutes) Every Easter, Grannie Annie gives Easter baskets to her granddaughters, Kelly (K) and Erin (E). The baskets contain small chocolate eggs (C) and jelly beans (J). Kelly and Erin like both types of candy, but compared to Erin, Kelly has a greater preference for chocolate eggs relative to jelly beans. Grannie Annie knows this, so she gives Kelly 20 chocolate eggs and 10 jelly beans and gives Erin 10 chocolate eggs and 20 jelly beans. This distribution of candy turns out to be Pareto optimal. | ||
|
a. |
In the diagram to the right, draw an Edgeworth box for the candy received by Kelly and Erin. Put chocolate eggs on the horizontal axis. and use the lower lefthand origin for Kelly. Indicate the distribution of candy between the two children, and label the quantities involved. Draw clearly labeled indifference curves through the distribution point. |
 |
|
| b. | Given Kelly and Erin's consumption bundles, which child, if
either, places the higher valuation on additional chocolate eggs relative to jelly beans?
How can you tell this from your diagram?
|
||
| c. | Suppose that last Easter, Grannie Annie mistakenly reversed the names on the two Easter baskets, leaving both Kelly and Erin worse off than usual. In the same Edgeworth Box you drew for part a, draw carefully labeled indifference curves through the resulting distribution of candy. | ||
| d. | Given their new consumption bundles, which child places the higher valuation on additional chocolate eggs relative to jelly beans? Clearly indicate how the different valuations show up in your diagram. | ||
| 6. |
(10 minutes) |
||
| a. | What do economists mean when they say that a
particular allocation of resources is "Pareto optimal"?
|
||
| b. | Label each of the following as "efficient" or "inefficient." If "efficient," explain why. If "inefficient," indicate the efficiency condition which is most clearly violated, and briefly describe why the resulting situation is wasteful. | ||
| (1) | Movie theaters charge lower ticket prices for senior
citizens than for younger adults.
|
||
| (2) | Movie theaters charge lower ticket prices for afternoon
shows than for their more crowded evening shows.
|
||
| (3) | Phone companies charge the same price for local calls no
matter how long the call lasts.
|
||
| c. | A simple economy produces two goods, food and clothing, with two inputs, labor and capital. Given the current allocation of labor and capital between the two industries, the marginal rate of technical substitution (MRTS) is 4 in food production and 2 in clothing production. Is this economy input efficient? If so, explain why. If not, describe a reallocation that will lead to a Pareto improvement. | ||