1.

|
Wednesday, February 20, 2013 |
|
||||||
|
Practice Exam 1 |
||||||
| 1. Please complete this practice exam on your
own before class on Wednesday. (Do not talk with anyone else
about the exam.) 2. Beginning with class-time on Wednesday, you may discuss the exam with your classmates. 3. You may not discuss this exam with anyone not enrolled in the class until after taking Exam 1. |
||||||
|
1. |
(5 minutes) | ||
| a. | In the diagram to the right, depict an initial equilibrium in the beer market. |
 |
|
| b. | Illustrate in your diagram what would happen if California lowered the legal drinking age for beer from 21 to 18. | ||
| c. | All else the same, would this reduction in the legal
drinking age cause beer consumption by adults age 21 or older
to rise, fall, remain the same, or
change in an uncertain direction? Explain briefly how you decided, and use your diagram to
support your answer.
|
||
|
2. |
(8 minutes) Consider the following
constant-elasticity demand function for cheese: Qd = 360ĚP-0.5 where Qd denotes pounds of cheese and P denotes the dollar price per pound. |
||||||||||||||||||||
| a. |
|
||||||||||||||||||||
| b. | Decide whether you agree or disagree with the
following statement, and briefly explain how you decided: Arc elasticity of
demand provides a close approximation of the more precise point elasticity
of demand.
|
||||||||||||||||||||
| c. | Based on your elasticity values, does total
expenditure move in the direction you would expect as price changes? How did
you decide?
|
||||||||||||||||||||
|
3. |
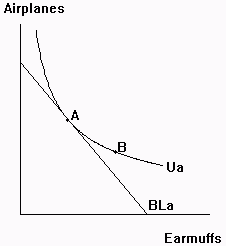
(5 minutes) Evander's optimal consumption
bundle shifts from point A to point B, as shown in the diagram to the
right. This could be a result of: I. Price of airplanes rises; price of earmuffs falls. II. Price of earmuffs falls; Evander's income rises. III. Price of airplanes rises; Evander's income rises |
 |
|
|
(1) I or II only (2) I or III only (3) II or III only (4) I, II, or III |
|||
| Support your answer.
|
|||
|
4. |
(5 minutes) Suppose that last year you spent all
of your entertainment budget on 12 musical album downloads (M) at $12 each and
36 video rentals (V) at $4 each. With this consumption bundle you were willing to trade
1 video rental for 3 musical album downloads. Did you maximize your utility
from your entertainment budget last year? If
so, explain why. If not, explain why not, and recommend the direction of any adjustment you
should have made in your consumption bundle and why.
|
| 5. | (6 minutes) Albert E. consumes only two goods:
X=neutrons (N) and Y=protons (P). The price of
protons (PP) is 1 quark. Albert's utility is given by the function: U = N0.25P0.75. Albert currently consumes 4 neutrons and 6 protons, and this consumption bundle maximizes his utility. In answering the following questions, you may use the diagram provided if you like, but you are not required to do so in order to receive full credit for this problem. If you refer to the diagram as part of your answer, I will grade it along with the rest of what you write. Calculate each of following values in the space below, and be sure to show your work or at least the formulas you used: |
|
| (1) Albert's marginal rate of substitution (MRS). (2) The price of neutrons (PN). (3) Albert's total money income (I).
|
||
| 6. | (8 minutes) Decide whether the following is
true or false, and explain your answer: "A product with perfectly inelastic
demand must be an inferior good." Draw an indifference curve-budget line diagram in the space to the right to help support your explanation: |
 |
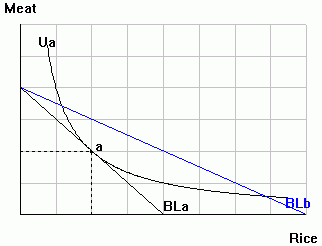
| 7. | (5 minutes) Jin is a Chinese peasant who spends all of her food budget on rice and meat. Point "a" in the diagram to the right illustrates her initial consumption optimum. Her budget line then shifts to BLb. Indicate in the diagram each of the following ranges of rice consumption that Jin might choose as both affordable and preferable given her new budget line. Feel free to add any other lines, curves or labels to the diagram that you might find helpful: |
 |
||
| a. |
All affordable and preferable levels of rice consumption consistent with the finding reported in the assigned reading. "Giffen Behavior and Subsistence Consumption," for Hunan province peasant households who derived up to 80% of their calories from rice. |
|||
| b. |
All affordable and preferable consumption for which both rice and meat are normal goods. |
|||
|
|
||||
|
8. |
(8 minutes) Assistant Professors at Oxy spend some of their income on apartment space (A), and the rest of their income (Ig) on other goods. | ||
| a. | In the diagram to the right, depict an initial optimum in an indifference curve diagram. Put A on the horizontal axis. Use an "a" to label your initial consumption bundle. |
 |
|
| b. | In response to the relatively high cost of housing in California, Oxy used to provide assistant professors with a rent subsidy. Show the consequences of the subsidy for the faculty member you depicted in part a. Label your new consumption point as "b." | ||
| c. | A few years ago, Oxy replaced its rental subsidy with a "budget-neutral" cash grant. In other words, the cash grant cost the College the same amount of money as the rent subsidy that it replaced. Depict the new budget line in your diagram and label it BLc. | ||
| d. | An Oxy administrator remarked recently that new Assistant
Professors are choosing to live in smaller apartments than they did under
the former rent subsidy policy. Are you surprised? If so, explain why. If
not, explain why not, and use your diagram to support your answer.
|
||