| 1. | Consider the choice between leisure and income for a worker who faces a wage of $10 per hour if she works. | ||
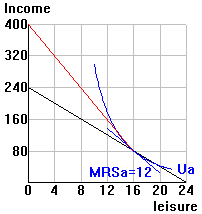
| a. | Using a diagram with leisure on the horizontal axis and income on the vertical axis, diagram this worker's budget constraint. Be sure to label the values for the budget-line endpoints. |  |
|
| b. | Suppose the worker currently works 8 hours per day and claims
her MRS is 12. Is she maximizing her utility? If so, explain why. If not, explain why not,
and indicate whether she should consume more or less leisure. Use you diagram from part a
to support your explanation. No--she should should work less, because value of leisure exceeds O/C of leisure. Answer key checklist: Did you show Ua as steeper than BL at l=16? |
||
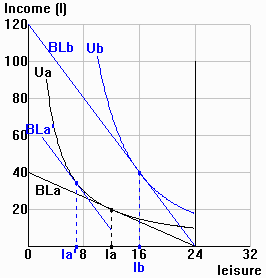
| c. | Now suppose that any hours worked over 8 result in
"overtime pay" of $20 per hour. Draw the new budget constraint, and label the
new budget-line endpoints. See kinked constraint for overtime. ($20 overtime wage) |
||

