| 3. |
Suppose that there are two groups (A and B) of
potential customers for a cultural programs cable TV channel. Each group consists of 1,000
potential customers with the following demands for cultural programs:
PA = 100 - .8(Q), and PB = 24 - .4(Q),
with prices measured in dollars. The supply curve for the channel's program is given by
PT = 40 + 1.6(Q)
where PT denotes the combined price collected from all customers, measured in
$1,000. |
|
a. |
How many cultural programs should the channel
offer? (Hint: notice that since PA and PB are measured in dollars, the same
demand equations measure PA and PB in thousands of dollars for each group of 1,000
consumers, which is the same unit of measurement used for PT in the supply equation.)
Q* = 30
PAt = 100-0.8(Q), PBt=24-.4(Q), both Pt's measured in $1,000.
Efficiency => Demnad: Pt = 124-1.2(Q) equals supply:
124-1.2(Q) = 40+1.6(Q) => Q=30 programs.
|
|
b. |
What should the price per program be for
each consumer in Group A? In Group B? How much revenue per program (PT) will the cultural channel collect?
PA = 76
PB = 12 PT ($1,000) =
88 ($1000)
PA = 100-.8(30)=76; PB=24-.4(30)=12. Channel will collect 88 ($1000) per program.
|
|
c. |
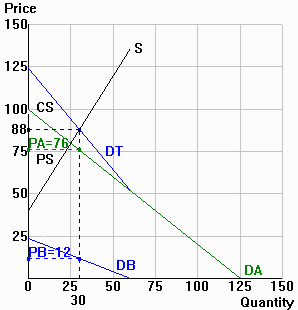
In the diagram to the right, draw (1) the combined demand
curve for the consumers in Group A (DA), (2) the combined demand curve for the consumers
in Group B (DB), (3) the combined demand curve of the two groups of consumers (DT) and (4)
the supply curve. Measure price in thousands of dollars.
(1) = DA; (2) = DB; (3) = DT; (4) = S
Answer key checklist: Did you clearly show a vertical
sum for DT? (The vertical intercept for DT = the two separate intercepts combined, and
since DA and DB have different horizontal intercepts, DT has a kink at the Q where the
lower demand curve ends.) |
 |
|
d. |
Indicate in the diagram (1) the equilibrium output, (2) the
total price collected, (3) the price collected from each of the two groups of consumers,
(4) total consumer surplus and (5) total producer surplus.
(1) = 30; (2) = 88; (3) = 12 and 76;
(4) = CS (area between DT and P=88 out to 30);
(5) = PS (area between P=88 and S out to 30). |
 |
|
|
