Jim Whitney Economics 250

Homework exercises #21: Key

Due: __________________________

Circle section: 12:50 / 1:55

Name: ______________________________
     
 
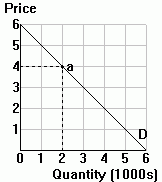
1. The Museum of Fine Arts (MFA) in Boston normally charges $4 for admission. Suppose that the number of MIT students who visit the MFA is given by: Q = 6000 - 1000P and that the marginal cost of additional visitors is 0.
a. Draw MIT's demand curve in the diagram to the right, and depict the equilibrium situation with the regular $4 admission price. See diagram
b. Why might it be reasonable to assume that MC=0? Most of the costs are fixed: buildings, exhibits. Even staffing doesn't change much with number of patrons, so MC of another patron is close to zero.
Consider two alternative ways of charging MIT students for admission to the MFA:
    Option A: Charge the normal price of $4.
    Option B: Collect a lump sum payment of $10,000 from MIT (financed by MIT out of student tuition revenues) and grant MIT students free admission.
c. Complete the following table comparing the two options:
  (1) (2) (3)
Option A Option B Change (2) - (1)
Consumer surplus $2,000 $8,000 +$6,000
Producer surplus $8,000 $10,000 +$2,000
Combined (market surplus) $10,000 $18,000 +8,000
d. How is it possible for Option B to make both MIT students and the MFA better off compared to Option A?
    Option B eliminates the $8,000 welfare loss from underconsumption. With P=$4, only 2,000 people go to the museum.With P=$0, 6,000 people go, raising total welfare by $8,000.
 
2. Consider an airline that faces two groups of travelers that have a different but constant price elasticity of demand. If the marginal cost per passenger is $60, how much should the airline charge each group of customers?
 
  Elasticity Price
Vacation travelers 4 $80
Business travelers 2 $120
   
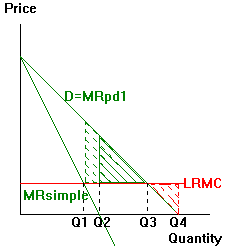
3. Consider the situation of the monopolist depicted in the diagram to the right.
a. Suppose the firm is a simple monopolist. Indicate the monopolist's profit-maximizing output level (Q1). Indicate its revenue-maximizing output level (Q2). Indicate the deadweight loss associated with each output level.
    See diagram.
b. Suppose instead that the firm is operated by a first-degree price discriminating monopolist. Indicate the firm's profit-maximizing output level (Q3). Indicate its revenue-maximizing output level (Q4). Indicate the deadweight loss associated with each output level.
    Note that there is no welfare loss for Q3.


4. This question concerns the supplementary readings selection, Case study: A big factor in prescription drug pricing: Location, location, location
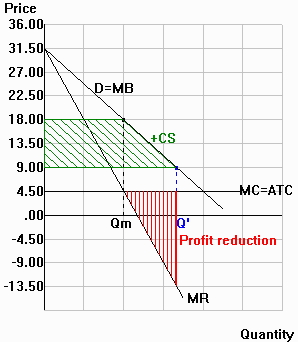
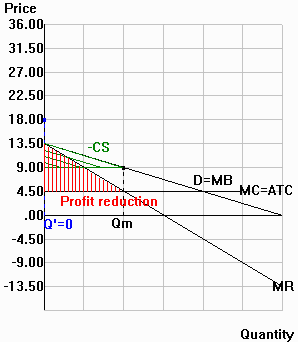
a. Use the two diagrams below to contrast the profit-maximizing price-discrimination strategy described in Passage A. (For simplicity, assume that PLC has a constant MC=ATC=$4.50.)
axes_240w_250h.gif (2792 bytes) axes_240w_250h.gif (2792 bytes)

United States

Uganda

   In the diagrams, Q= Qm, Pus = 18 and Pug = 9.
(1) Use MR and MC in your U.S. diagram to highlight exactly how much profit is lost if all PLC sells for $9. In red
(2) Use MR and MC in your Uganda diagram to highlight how much profit is lost if all PLC sells for $18. In red
(3) Which loss does Varian expect is larger for PLC?

The larger loss is in the US if P=9 than in Uganda if P=18.


(4) How does the outcome differ for the antimalarial drug described in Passage B? (Just discuss the difference; don't draw a new set of diagrams.)

The situation is reversed for the anitmalarial drug, since the larger market and profits are in Uganda.


b. Indicate in each diagram how much consumer surplus changes under each alternative single-price option for PLC.
   Marked in green.
c. Suppose the World Health Organization decides to make the offer described in Passage C available for PLC. How large would the prize have to be for PLC's manufacturer to accept it? It would have to = the PLC profits at Qm