Homework exercises #17: KEY |
||||||
|
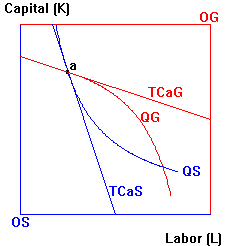
1. | Use an Edgeworth box diagrams to demonstrate why the
following situation is inefficient: The United Steelworkers Union has been successful in
raising steel industry wages above the average level which prevails in industries
producing "other goods." (Illustrate capital as the alternative input to labor.) Note: PLs > PLg => PLs/PK > PLg/PK => MRTSs = PLs/PK > PLg/PK = MRTSg Answer key checklist: Did you make it clear which point the firms are currently at inside the Edgeworth Box? Tip: To construct an Edgeworth Box: (1) Draw box, label axes and origins. (2) Is allocation efficient? Yes => show a tangency. No = show a lens. (3) If you have a lens, choose the correct intersection point: How does relative value of X for the party at the lower left origin compare to the other party? Higher => choose the upper intersection; Lower => choose the lower intersection. |
![]() |
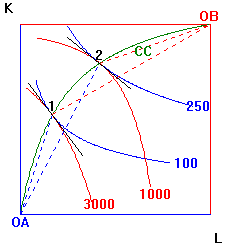
2. | Consider an economy which uses labor (L) and capital (K) to produce advanced goods (A) and basic goods (B). Both industries are perfectly competitive. In the accompanying Edgeworth Box for inputs, CC denotes the economy's contract curve. | ![]() |
||
a. | Which industry is more labor-intensive? How can
you tell? B is more labor-intensive. All along the contract curve, (K/L)B < (K/L)A Answer key checklist: Did you measure K/L ratios by using the slopes of rays from the origins to the input combinations used? |
|||
b. | Consider the shift from point 1 to 2, and answer each of the following questions, briefly explaining how each answer shows up in the diagram: | |||
(1) | Which industry contracts, the
capital-intensive industry or the labor-intensive industry? The labor-intensive industry (B) contracts--2 is on a lower isoquant for B (QB=1000) than 1 (QB=3000). |
|||
(2) | Does the equilibrium price of labor relative to capital
(PL/PK) rise or fall? PL/PK falls--the MRTS line through the tangency points is flatter at point 2 than point 1. |
|||
(3) | Do producers in the two industries switch to more or less
labor-intensive production techniques? Producers switch to more labor-intensive production techniques: The K/L-ratio, which shows up as the slope of the ray from the origins to each of the the two points, is lower for both industries at 2 than 1. |
|||
3. |
(from Frank, Ch.16) A simple economy produces
two goods, food and clothing, with two inputs, labor and capital. Given
the current allocation of labor and capital between the two industries,
the marginal rate of technical substitution of labor for capital (MRTS =
MPL/MPK) is
4 in food production and 2 in clothing production . Is this economy input
efficient? If so, explain why. If not, describe a reallocation that will
lead to a Pareto improvement. MRTS food = 4 > MRTS clothing = 2. So food producers value extra labor more highly than clothing producers do. So production of both goods will rise if food producers acquire more labor from clothing producers in exchange for capital. Answer key checklist: (1) Did you recommend an exchange of inputs (which would make it possible for both outputs to rise)? (2) Did you recognize that the 4 and the 2 referred to MRTS's and not K/L ratios? (3) Did you recognize that the relative productivity of labor was higher in food, so that the food industry should be the one to get more labor? |
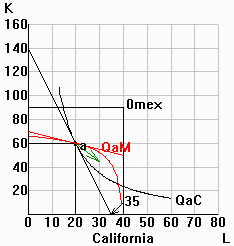
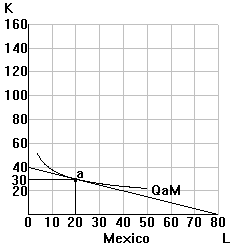
4. | Suppose that the points labeled "a" in the diagrams below indicate the maximum output that California (C) and Mexico (M) can produce using all of their currently available stocks of labor and capital. | |||
a. | Based on data from point a in each diagram: (1) Lca= 20 (2) Kca= 60 (3) Lmex= 20 (4) Kmex= 30 (5) Ltotal = 40 (6) Ktotal = 90 |
![]() |
![]() |
|
b. | MRTSc= 4 MRTSm= 1/2 |
|||
c. | In the lefthand panel, rotate the panel for Mexico to construct an Edgeworth box illustrating the combined situation of California and Mexico. (Hint: use your answers to part b to help you construct the dimensions of your box.) | |||
d. | What direction of exchange of resources would
allow both California and Mexico to produce more output? Explain briefly, and indicate the
direction with an arrow in your diagram. Labor to CA for capital to Mex--relative value of labor is higher in CA than in Mex.
|
|||
e. | In the real world, we don't formally exchange
labor and capital with each other, but increasingly resources simply migrate from one
location to another. What types of resource migration actually occur between the U.S.
(including California) and Mexico? Are they consistent with your answer to part d? Explain
briefly. Workers migrate to the U.S. as immigration and capital migrates to Mexico as foreign investment, which is similar to the exchange described in part d. |
|||