Jim Whitney Economics 250

Friday, February 01, 2013


Homework exercises #2

Due: __________________________

Circle section: 12:50 / 1:55

Name: ______________________________
     
 
1. In 1879 a law was passed in Massachusetts restricting the number of hours women could work in manufacturing to no more than 10 hours per day and 60 hours per week. h02_f1.gif (1956 bytes)
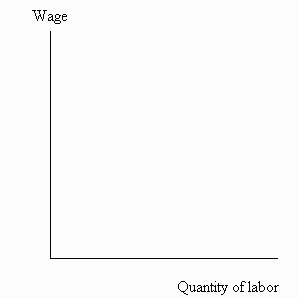
a. In the diagram to the right, draw a demand curve for labor in manufacturing and a male labor supply curve and total (male and female) pre-legislation labor supply curve. Indicate the equilibrium wage (W), the total quantity of labor supplied (Lt), and the quantities of men (Lm) and women (Lw) hired. (Note: men and women are equally qualified for the manufacturing jobs.)
b. Show the effect of the legislation on the equilibrium wage and total quantity supplied of labor.
c. Decide whether each of the following rises, falls, remains the same or changes in an uncertain direction, and explain each decision briefly:
(1) total expenditures (W x Lt) on labor by manufacturing employers:


(2) total income (W x Lm) received by men:


(3) total income (W x Lw) received by women:


2.

Decide whether the following is true or false and explain briefly: "Removal of natural gas price ceilings is likely to cause an increase in supply which could lower prices for consumers."


3. The diagrams for this problem illustrate the wheat market. Suppose that the government decides that farmers should receive a price of $8 per bushel for the wheat they sell.
  a.

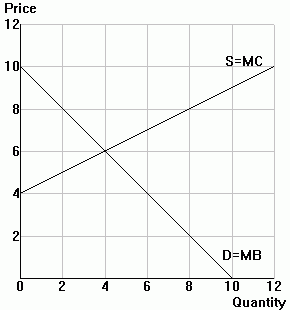
Option A: Suppose that the government implements a wheat subsidy to achieve its goal. Illustrate each of the following in the diagram to the right:

h02_f1.gif (1956 bytes)
     
    Notation
(1) Equlibrium quantity Qsub
(2) Price buyers pay PBsub
(3) Price sellers receive PSsub
(4) Change in consumer surplus \\\
(5) Change in producer surplus ///
(6) Change in government revenue |||
(7) Change in social welfare Bold outline
 
           
  b.

Option B: Suppose instead that the government implements a price floor and buys up any surplus wheat at the floor price. The wheat gets stockpiled by the government and ultimately rots in storage. Illustrate each of the following in the diagram to the right:

h02_f1.gif (1956 bytes)
     
    Notation
(1) Quantity supplied QS
(2) Quantity demanded QD
(3) Quantity bought up by the government Qsurplus
(4) Change in consumer surplus \\\
(5) Change in producer surplus ///
(6) Change in government revenue |||
(7) Change in social welfare Bold outline
 
  c.

Which policy do you think is better in terms of efficiency? In terms of equity? How did you decide?