 |
 |
| International coffee market | Coffee farmer Juan Valdez |
|
Friday, March 22, 2013 |
Equilibrium in the long run
Example: the international coffee market
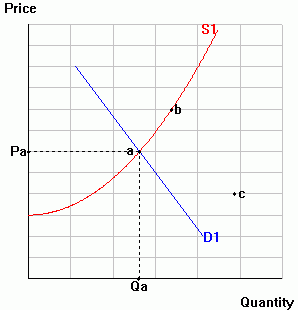
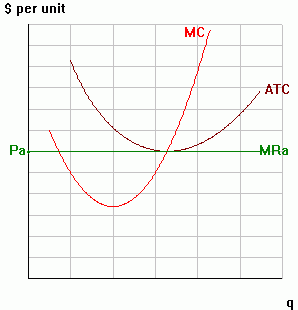
The diagrams below illustrate the situation at the end of World War II in the international coffee market and for a typical Colombian coffee farmer, Juan Valdez.
 |
 |
| International coffee market | Coffee farmer Juan Valdez |
Complete each of the following steps. To simplify, assume that coffee is a constant cost industry, which means that the cots curves of the typical farmer remain the same as the industry size rises and falls.
Label "qa" for Juan Valdez in 1945.
By 1950, the European market had rebounded from the naval blockades that had restricted demand during WWII. Draw D2 through points b and c, and illustrate the new situation for Juan Valdez. Be sure to indicate his profits or losses. The income elasticity of demand for coffee is about zero, so assume that there is no further change in demand for the rest of this example.
New coffee trees take 4-5 years to yield their first crop, and yields then rise until the trees are 10-15 years old. Because of the long lags, there is a tendency for coffee farmers to overplant during boom times. Draw S2 through point c to illustrate how the market might have looked by the early 1970s. Again be sure to indicate the profits or losses earned by Juan Valdez.
In the mid-1970s, a major frost in Brazil killed many of its coffee trees, especially in the coffee-growing state of Parana. Assume that just enough trees died to bring the market back to a long-run equilibrium. Indicate how the situation would look in your diagrams (label it "d").