| Example: Suppose PL = $6; PK = $3
|
| |
|
| Part 1: The long run: Use
the price information above and the diagram to the right to fill in the following table of
total and average total cost information (focus on points a,b,c,d, and e; ignore points a'
and c' for now): |
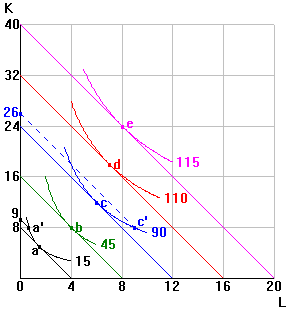 |
| Pt. |
Q |
LRTC |
LRATC |
| a |
15 |
$24 |
$1.60 |
| b |
45 |
$48 |
$1.07 |
| c |
90 |
|
|
| d |
110 |
|
|
| e |
115 |
|
|
|
Part 2: The short run: Now consider the short run, with the firm's
capital fixed at K=8. The firm can change output only by varying the amount of labor it
uses. Use the price information and the diagram to fill in the following table of
short-run total cost and average total cost information: |
| Pt. |
Q |
SRTC |
SRATC |
| a' |
15 |
|
|
| b |
45 |
$48 |
$1.07 |
| c' |
90 |
|
|
|
| |
|
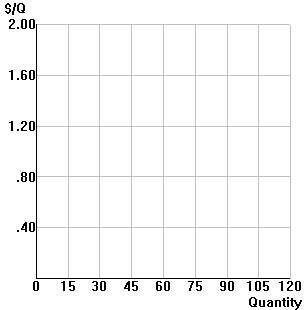
| Plot the firm's LRATC and SRATC curves in the
diagram below: |
 |