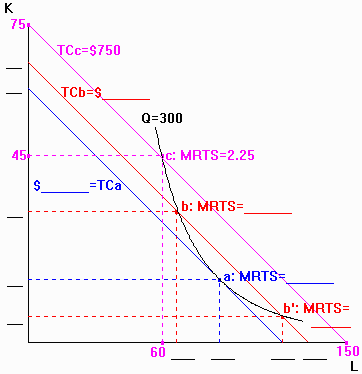
You are the manager of the Axes Corporation
which uses labor (L) and capital (K) to produce X and Y axes for course
diagrams. The price of workers is $5 per unit and the price of capital is
$10 per machine. You have orders to produce 300 axes.
Step 1: Use the following information about your
production to complete the table: |
| Case |
Q |
K |
L |
MPL |
Q |
K |
L |
MPK |
TC300 |
MPL/PL |
MPK/PK |
| 1 |
298 |
6 |
119 |
2 |
284 |
5 |
120 |
16 |
$660 |
0.4 |
1.6 |
| 300 |
6 |
120 |
300 |
6 |
120 |
| 2 |
295 |
30 |
71 |
|
296 |
29 |
72 |
|
|
|
|
| 300 |
30 |
72 |
300 |
30 |
72 |
| 3 |
297 |
15 |
89 |
|
294 |
14 |
90 |
|
|
|
|
| 300 |
15 |
90 |
300 |
15 |
90 |
|
| |
| Step 2: Each case above corresponds to either point a, b, or b' in
the diagram to the right. Decide which case goes with which point, and then
complete the table below. |
 |
| Point: |
a |
b |
b' |
c |
| Case #: |
|
|
|
--- |
| L: |
|
|
|
60 |
| K: |
|
|
|
45 |
| MPL: |
|
|
|
9 |
| MPK: |
|
|
|
4 |
| MRTS: |
|
|
|
2.25 |
| TC: |
|
|
|
750 |
| Isocost line endpoints: |
| L-axis: |
|
|
|
150 |
| K-axis: |
|
|
|
75 |
|
| Step 3: label the
diagram with the numerical values from the table (the data for point c are
provided as an illustration): |
