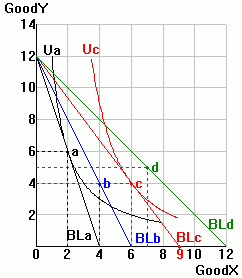
| Consider the sequence of optimal
consumption points as a decline in the price of X moves you from a to d in the diagram to the right. Step 1: Add indifference curves Ub and Ud to the top diagram. The Price Consumption Curve (PCC) Step 2: Draw a curve through the optimal consumption points in the
top diagram. The curve you have drawn is the consumer's price-consumption curve (PCC).
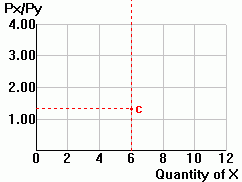
Consumer Demand Step 3: Use information from the indifference curve/budget line diagram to complete the following table:
Step 4: In the lower right hand panel, plot the consumer's demand curve. (Available online (Java): PCC and demand geometry) |
  |
||||||||||||||||||||||||||||||