|
|
Monday, February 04, 2013 |
Indifference curve examples
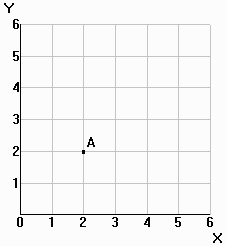
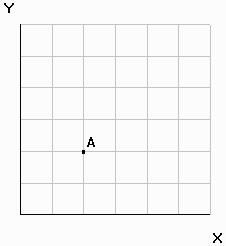
Draw an "indifference map" for each pair of
items below by doing the following:
Step 1: Draw one indifference curve (U1) through point A.
Step 2: Draw a second indifference (U2) showing a higher level of
utility.
Hint: Try increasing one item while holding the other constant and ask
whether you better off or not. If not, you are still on the same indifference curve. If
so, adjust the other item until you are back on the same indifference curve again.
Consider consumption only. You either use them or lose them--you can't sell
them, but you have free disposability

|

|
Case 1
X-axis = left shoes
Y-axis = right shoes |
Case 2
X-axis = white grapefruit
Y-axis = pink grapefruit
(assume both taste the same) |
| |
|

|

|
Case 3
X-axis = local concert tickets (for your favorite performers)
Y-axis = uselessly far away basketball tickets |
Case 4
X-axis = fuel economy
Y-axis = auto fatality risk |


