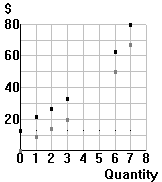
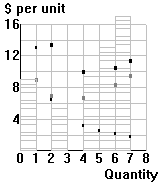
Complete the following table, then plot the
missing information in the diagrams below, and draw and label the curves: |
| (1) |
(2) |
(3) |
(4) |
(5) |
(6) |
(7) |
(8) |
| Q |
TC |
TVC |
TFC |
ATC |
AVC |
AFC |
MC |
| 0 |
13 |
$ 0 |
$13 |
$ --- |
$ --- |
$ --- |
$ --- |
| 1 |
22 |
9 |
|
22.00 |
9.00 |
13.00 |
9.00 |
| 2 |
27 |
14 |
13 |
13.50 |
7.00 |
6.50 |
|
| 3 |
33 |
20 |
13 |
|
|
|
6.00 |
| 4 |
|
|
13 |
10.00 |
6.75 |
3.25 |
|
| 5 |
|
|
13 |
|
|
2.60 |
10.00 |
| 6 |
63 |
50 |
13 |
10.50 |
8.33 |
2.17 |
13.00 |
| 7 |
80 |
67 |
13 |
11.43 |
9.57 |
1.86 |
17.00 |
|
 |
|
| In the diagram to the right, plot the missing values from the
table, and draw the total cost (TC), total variable cost (TVC), and total fixed cost (TFC)
curves. |
 |
| In the diagram to the right, plot the missing values from the
table, and draw the MC, ATC, AVC and AFC curves. |
 |
|
|

