| Complete the following table: | ||||||||||||||||||||||||||||||||||||
|
||||||||||||||||||||||||||||||||||||
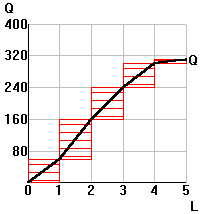
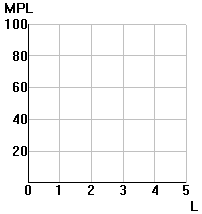
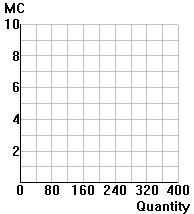
| Function (1), the production function (Q) in the table above has already been plotted below. In the other two panels, plot the (2) the marginal product of labor function (MPL) and (3) the marginal cost function (MC). MC will turn out to be a sort of "step" function which is horizontal over a range of output before jumping to a new level. | ||||||||||||||||||||||||||||||||||||
| (1) | ||||||||||||||||||||||||||||||||||||
 |
||||||||||||||||||||||||||||||||||||
 |
 |
|||||||||||||||||||||||||||||||||||
| (2) | (3) | |||||||||||||||||||||||||||||||||||