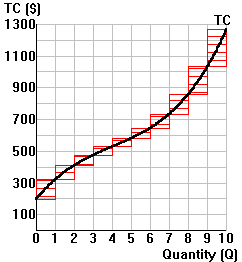
| Example: Total production costs in the short run (small
number of units) TC formula: TC = 146 +147Q - 24Q2 + 2Q3 |
|||||||||||||||||||||||||||||||||||||||||||||||||
 |
|||||||||||||||||||||||||||||||||||||||||||||||||
|
 |
||||||||||||||||||||||||||||||||||||||||||||||||
 |
|||||||||||||||||||||||||||||||||||||||||||||||||
|
|||||||||||||||||||||||||||||||||||||||||||||||||
Deriving marginal and average values from total value curves
| Example: Total production costs in the short run (small
number of units) TC formula: TC = 146 +147Q - 24Q2 + 2Q3 |
|||||||||||||||||||||||||||||||||||||||||||||||||
|
|||||||||||||||||||||||||||||||||||||||||||||||||
|
|
||||||||||||||||||||||||||||||||||||||||||||||||
|
|||||||||||||||||||||||||||||||||||||||||||||||||
|
|||||||||||||||||||||||||||||||||||||||||||||||||
| Step 1: | Fill in the rest of the table. | |||||||||||||||
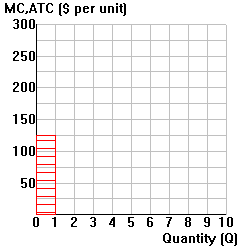
| Step 2: | Plot the MC values in the lower righthand diagram and trace out the MC curve. | |||||||||||||||
| Step 3: | Plot the ATC values in the lower righthand diagram and trace out the ATC curve. | |||||||||||||||
| Step 4: | Complete the following table about the relationship between total value (TV) and marginal value (MV): | |||||||||||||||
|