| You can examine any total
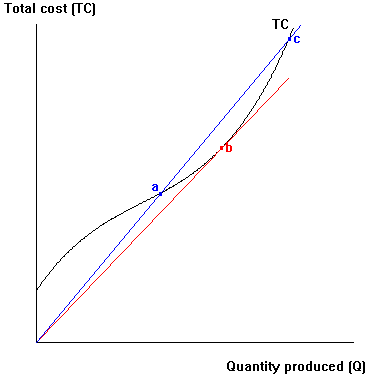
value function to find the marginal and average values related to it. The example here shows a total cost (TC) function for a firm. When we examine it, we can see how the firm's marginal cost (MC) and average total cost (ATC) behave. |
|||
 |
|||
| 1. | Consider the three points a, b and c in the diagram, and use the notation >,<,=,? to compare values for each of the following: | ||
| 1. MCa ___ MCb | 4. ATCa ___ ATCb | 7. MCa ___ ATCa | |
| 2. MCb ___ MCc | 5. ATCb ___ ATCc | 8. MCb ___ ATCb | |
| 3. MCa ___ MCc | 6. ATCa ___ ATCc | 9. MCc ___ ATCc | |
| 2a. | Indicate approximately where in the diagram MC reverses its behavior. | ||
| 2b. | Does MC (1) fall and then rise as Q rises, or (2) rise and then fall as Q rises? ____ | ||
| 3a. | Indicate approximately where in the diagram ATC reverses its behavior. | ||
| 3b. | Does ATC (1) fall and then rise as Q rises, or (2) rise and then fall as Q rises? ____ | ||