Problem Set 1
Note: For numerical computations, be sure to show your work. If you use a calculator, at least show how you set up each problem.
OPPORTUNITY COST AND BENEFIT-COST DECISION MAKING | ||
1. |
Mankiw, Chapter 1, Problems and Applications number 4. | |
2. | Consider the economic (opportunity) cost of raising a child for its first year of life. Suppose clothing, feeding and housing costs total $3,000. Suppose also that the primary-care parent gives up all other activities to engage in full-time child care. | |
a. | Without the child, the primary-care parent, could earn $26,000 in a full-time factory job. What estimate would you suggest for the minimum value to this family of the first-year opportunity cost of the child? Explain. | |
b. | Suppose that, without the child, the primary-care parent would pass up the available factory job and choose instead to work for $4,000 in a part-time office job and devote the rest of his/her time to volunteer work for a local charity. Would this change the cost estimate of the child's first year that you calculated in part a? Explain. | |
3. | Consider the diagram we drew in class to depict the benefits and costs of Mark Sullivan's medical training. | |
a. | Draw a similar diagram for yourself in which you depict the labor-market benefits and costs of your decision to get a college degree instead of pursuing a career with just a high-school degree. | |
b. | Now suppose that, along with your decision to attend college, about six years from now you expect to quit your job and leave the labor market for fifteen years. Indicate in your diagram the minimum that you would lose of your expected college-degree benefits if you do this. Does this increase or decrease your incentive to attend college? Explain briefly. | |
c. | Women are less likely to leave the labor market for their childbearing years now than in the 1960s. Use this fact plus your answers from parts a and b to help you explain why the percentage of enrolled college students who are women increased from 33 percent in 1960 to 56 percent in 2000. (source: http://www.census.gov/prod/2003pubs/02statab/educ.pdf) | |
4. |
Use the following information about the median annual earnings of males and females in 2006-2008 to answer the questions below: | |||||||||||||
|
||||||||||||||
a. | Assuming equal direct college expenses (tuition, books, etc.) for both men and women, do they face the same economic cost of attending college? Explain your answer. | |||||||||||||
b. | Are the benefits of a college degree equal for both men and women? Again, explain your answer. | |||||||||||||
5. | Mankiw, Chapter 2, Problems and Applications number 6. | |
THE PRODUCTION POSSIBILITIES FRONTIER | |||||||||||||||||
6. |
Consider the following information about an economy's production possibilities for "pleasures of the flesh" and "pleasures of the spirit": | ||||||||||||||||
|
|||||||||||||||||
a. | Graph the economy's production possibilities frontier (PPF), putting Flesh on the horizontal axis and Spirit on the vertical axis. | ||||||||||||||||
b. | Use "///" to shade currently unattainable production points and "\\\" to shade production points which are attainable but associated with inefficiency and/or unemployment. | ||||||||||||||||
c. | What is the (marginal) opportunity cost of the third unit of Flesh? The fourth unit? | ||||||||||||||||
d. | Depict the possible consequences of each of the following in your PPF diagram (consider each event separately, and be keep in mind that some events shift the PPF while others only keep an economy from reaching its PPF): | ||||||||||||||||
(1) | A severe economic recession temporarily raises the unemployment rate. | ||||||||||||||||
(2) | A technological breakthrough increases the productivity of resources in the Spirit industry by 50 percent. | ||||||||||||||||
(3) | Discrimination by some employers results in inefficient production because some "less qualified" individuals end up employed in the Flesh industry when "more qualified" workers are available. | ||||||||||||||||
7. |
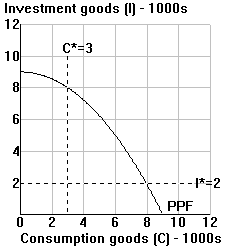
Consider the production possibilities frontier to the right. C* represents the economy's subsistence level of consumption; if consumption drops below C*, some people will starve. I* represents the level of investment necessary to replace worn out equipment and keep the PPF in its present position; with less investment, the PPF will shrink next year, with more investment the PPF will grow. | ![]() |
||
a. | Indicate where the economy will produce for each of the following goals: | |||
(1) | Grow as rapidly as possible without starving its citizens. | |||
(2) | Enjoy as much consumption as possible without reducing its PPF in the future. | |||
(3) | Produce C* or more of consumption goods and I* or more of investment goods. | |||
b. | Suppose that a severe disaster forces the country's PPF to shift in until it is barely possible to produce I* and C*. Draw the economy's new PPF, and answer the questions for part a again. | |||
THE BASICS OF SUPPLY AND DEMAND | ||
8. |
Mankiw, Chapter 4, Problems and Applications number 13. | |
9. |
Draw supply and demand curves for the chicken market to illustrate each of the following, and for each case indicate whether the equilibrium price and quantity of chicken would rise, fall, remain the same, or change in an uncertain direction: | |
a. | A severe poultry disease kills a large number of chickens. | |
b. | The Betty Crocker firm develops a cheaper, quicker stuffing mix to use with chicken. | |
c. | A case of "mad cow disease" results in the slaughter of a large number of cattle for precautionary reasons | |
d. | Additional health warnings are released about the presence of salmonella bacteria in chicken, and the price of chicken feed rises. Be sure to consider the combined effect of the two events. | |
e. | A technological breakthrough makes it possible to raise chickens to full size more quickly and cheaply. | |
f. | The government charges chicken farmers a $1 tax for each chicken they sell. Can you tell from your diagram whether the price of chicken changes by $1, or by more or less than $1? | |
10. |
Mankiw, Chapter 4, Problems and Applications number 9. | |
11 . | Consider the hypothetical data below about the film market. The data in the bottom two rows of the table reflect events affecting the film market equilibrium data in the top two rows of the table. Depict the sequence of events in a single supply and demand diagram for the film market, and carefully explain any shifts you show for your supply and demand curves. | ||||||||||||||||||||||||||
|
|||||||||||||||||||||||||||
(Note: assume no other events occurred over the three-month period.) | |||||||||||||||||||||||||||
12. | Answer the questions that accompany the online reading, "The Price of Beer Rises at a Heady Pace, but Americans Are Thirstier Than Ever." | |
13. |
Answer questions 1 and 2 that accompany the online reading, "Moonshiners in South Find Sales Are Down As Their Costs Go Up." | |
14. |
Staple your work. (stapling always carries the weight of one problem on each problem set.) | |