FP: G and T.
Controlled by Pres/Congress.
Raise G, lower T.
MP: RRR, discount rate, open market operations.
Controlled by Fed.
Lower RRR, discount rate; buy government securities.
Problem Set 6: Key
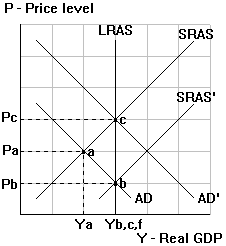
| 1. | a. | Draw an AD/SRAS/LRAS diagram which shows the economy experiencing a recession. Point a in diagram. |  |
| b. | Illustrate in your diagram where the economy will end up if the self-correction mechanism cures the recession. Point b in diagram. | ||
| Suppose instead that the government uses its policy tools to cure the recession. | |||
| c. | What is meant by countercyclical macroeconomic policy? Countercyclical macroeconomic policy = policy designed to counteract private sector shocks in order to prevent business cycles. | ||
| d. | What are the tools of fiscal policy, who controls them, and
how would they be adjusted to cure the recession? FP: G and T. Controlled by Pres/Congress. Raise G, lower T. |
||
| e. | What are the tools of monetary policy, who controls them, and
how would they be adjusted to cure the recession? MP: RRR, discount rate, open market operations. Controlled by Fed. Lower RRR, discount rate; buy government securities. |
||
| f. | Illustrate in your diagram where the economy will end up if expansionary macroeconomic policies are used to cure the recession. Point c in diagram. | ||
|
2. |
Suppose the required reserve ratio is .15 (15% of deposits received), and that the public always redeposits into some bank all the currency it receives. However, banks also maintain an idle excess reserve ratio of 10% of deposits received. Complete the following table to track the results if the Fed buys $24,000 of government securities (T-bills) from the public: | ||||||||||||||||||||||
|
|||||||||||||||||||||||
|
3. |
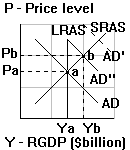
Use a credit-market diagram and an AD/SRAS/LRAS diagram to illustrate the short-run effects of each of the following (assume the economy begins at full employment, consider each case separately, and draw separate diagrams for each case): | ||
|
|
|
||
| a. The Fed sells government securities on the open market. | b. The Fed lowers the discount rate. | ||
|
4. |
In a news report a few years ago, a Clinton administration official expressed worries that the deficit cuts that would be required by a balanced budget amendment might harm the economy too much. The same official estimated that each dollar of government spending financed by borrowing crowds out 30 to 70 cents worth of investment. | ||
| a. | Explain how "deficit cuts" could "harm the
economy." "deficit cuts" => -G,+T => AD shifts left => -Y => can "harm the economy." |
||
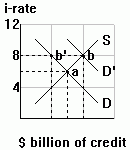
| b. | Diagram and explain how deficit spending can "crowd out
private spending." deficit spending => increased government borrowing => Dcr shifts right => +i, -I => can "crowd out private spending." (I falls with the movement along the original D from point a to b'.) |
  |
|
|
5. |
During the first Clinton administration, policies were adopted to reduce the federal budget deficit. Fed Chair Alan Greenspan expressed support for the deficit reductions, and the Fed cushioned the impact on the macroeconomy with some expansionary monetary policy. Indicate whether the combined impact of both policies would tend to make each of the following rise, fall, remain the same, or change in an uncertain direction compared to what would have happened without the policy combination: (1) real GDP, (2) the price level, (3) interest rates, (4) investment, and (5) the national debt. | |||||||||||||||||||||||||
|
||||||||||||||||||||||||||
|
6. |
Complete the table below to indicate whether the listed policy makes real GDP, the price level (GDP deflator), the real interest rate and investment rise (+), fall (-), remain the same (0), or change in an uncertain direction (?); consider both output-market and credit-market effects in each case: | |||||||||||||||||||||||||||||||
|
||||||||||||||||||||||||||||||||
|
7. |
Indicate whether each of the following statements is most likely to made by a Keynesian economist (K), a monetarist concerned with crowding out (M), a new classical economist (NC) or a supply-side economist (SS): | ||
| a. | K | "Discretionary macroeconomic policy plays a useful role in reducing the loss of output due to resources left idle during a recession." | |
| b. | M | "The large budget deficits of the 1980s were accompanied by historically high real interest rates." | |
| c. | NC | "Most research indicates that there is no link between budget deficits and interest rates; higher deficits may simply be matched by higher savings." | |
| d. | M | "Contractionary fiscal policy is not likely to be a very effective weapon against inflation, because the impact will be offset by the effects of lower interest rates." | |
| e. | SS | "Lower marginal tax rates stimulate people to work, save and invest, resulting in more output and a larger tax base." | |
| f. | NC | "Since taxpayers are concerned about the welfare of succeeding generations, they consider debt financing of government spending to be equivalent to tax financing." | |
| g. | K | "The self-correcting mechanism is too slow and unreliable to be relied on to cure recessions." | |
| h. | M | "The best combination of policies is to rely on automatic stabilizers and to keep the money supply growing at a constant rate." | |
| i. | SS | "Tax cuts can reduce inflation by increasing aggregate supply." | |
| j. | M | "Because of policy lags, discretionary stabilization policy often ends up being procyclical rather than countercyclical." | |
|
8. |
Suppose that the current equilibrium exchange rate between dollars and the Japanese yen is 100 yen per dollar. Suppose also that at this exchange rate, exports equal imports. | |
| a. | Now suppose that the Japanese interest rate rises. Will
individuals tend to transfer savings to Japan or vice versa? Explain briefly.
+i in Japan --> savings shift to Japan to earn a higher return. |
|
| b. | What term describes the resulting change in the foreign
exchange market value of the dollar? --> $ depreciation (fall in the value of the $) |
|
| c. | Will the net exports of the U.S. (X-M) tend to rise or fall?
Why? --> +(X-M) (increased international competitiveness --> +X and -M) |
|
|
9. |
Indicate how each event below would affect each of the following: (1) real output, (2) the price level, and (3) net exports (exports minus imports). Consider each event separately. | ||||||||||||||||
|
|||||||||||||||||
Spring 2010 stops here.
|
10. |
Suppose the following information represents the potential weekly output of autos and airplanes in the U.S. and Canada for a typical worker: | ||||||||||||||||||||||||||
|
|||||||||||||||||||||||||||
| In other words, in the U.S. a worker can produce either 16 autos OR 4 airplanes in a week, while in Canada, a worker can produce either 12 autos OR 2 airplanes in a week. | |||||||||||||||||||||||||||
| a. | Which country has the absolute advantage in auto
production? In airplane production? Explain briefly. AbsAdv: Autos: US Airplanes: US US has greater output of both per labor time |
||||||||||||||||||||||||||
| b. | Which country has the comparative advantage in
auto production? In airplane production? Explain briefly, and show the opportunity cost of
producing each good in each country. CompAdv: Autos: Canada: (OC 1car = 1/4 plane in US; 1/6 plane in Can) Airplanes: US: (OC 1 plane = 4 cars in US; 6 cars in Can) |
||||||||||||||||||||||||||
| c. | If there were trade between the U.S. and Canada
in these two products, who would tend to export autos and import airplanes? Explain
briefly. Canada will export autos and import planes since Canada has Comp.Adv. in autos. |
||||||||||||||||||||||||||
| d. | Now suppose that the U.S. and Canada agree to a weekly trade of 34 autos for 7 airplanes. Two workers in the U.S. then switch from autos to airplanes, and three workers in Canada switch from airplanes to autos. Complete the table below to show that both Canada and the U.S. end up with more of both goods to consume: | ||||||||||||||||||||||||||
|
|||||||||||||||||||||||||||
| 11. | Suppose the U.S. produces heavyweight motorcycles and can also import as many of them as it wants at a free-trade price of $3,400 each. | |||||||||||||||||
| a. |
Use the following information to draw a supply and demand diagram that contrasts free trade and a tariff equilibrium in the domestic heavyweight motorcycle market: |
|||||||||||||||||
|
||||||||||||||||||
| b. |
Indicate in your diagram and compute values for the following effects of the tariff: |
 |
||||||||||||||||
| (1) | cost to consumers (change in consumer surplus);
= loss = abcd = -$105 million |
|||||||||||||||||
| (2) | gain to producers (change in producer surplus);
= gain = a = +67.5 million |
|||||||||||||||||
| (3) | tariff revenue; and = c = +15 million |
|||||||||||||||||
| (4) | net social cost. = bd = -22.5 million |
|||||||||||||||||
| c. |
What size quota would have the same impact on
quantities and price as the indicated tariff? |
|||||||||||||||||