Problem Set 2: Key
1. |
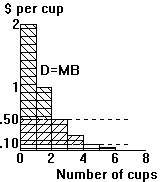
a. | 3 cups; buy as long as marginal benefit > price (here, $.50). | ||
b. | Consumer surplus = benefit in excess of
expenditure. Here: TB = 2.00 + 1.00 + .50 = $3.50 TE = 3 x .50 1.50 CS = (\\\ in diagram) 2.00 Note: a rough linear sketch is fine. |
![]() |
||
c. | CS would fall by $.25 | |||
d. | 5 cups.
CS would rise to $3.35 (TB=3.85; TE=.50) (adds /// in diagram) |
|||
e. | (1) | Drink 7 cups. TB = $3.90; TE = 1.75 => CS = $2.15 | ||
(2) | Since $2.15 of CS with free refills > CS of 2.00 when
P=$.50, you prefer the 1.75 + free refills. (TB = entire area under D, marked with the horizontal lines) |
|||
2. | a. | See diagram | |
b. | Sell 5 books.
TR = 5 x $15 = $75 TC = 5 hours x $10 = $50. PS = TR - TC = 75-50 = $25 |
||
3. | a. | From Ernie's supply schedule and Bert's demand schedule, the quantity demanded and supplied are: | |||||||||||||
|
![]() |
||||||||||||||
Only a price of $4 brings supply and demand into equilibrium, with an equilibrium quantity of 2. | |||||||||||||||
b. | At a price of $4, consumer surplus is $4 and producer surplus is $4. Total surplus is $4+$4=$8. | ||||||||||||||
c. | If Ernie produced one fewer bottle, his producer surplus would decline to $3. If Bert consumed one fewer bottle, his consumer surplus would decline to $3. So total surplus would decline to $3+$3=$6. | ||||||||||||||
d. | If Ernie produced one additional bottle of water, his cost would be $5, but the price is only $4, so his producer surplus would decline by $1. If Bert consumed one additional bottle of water, his value would be $3, but the price is $4, so his consumer surplus would decline by $1. So total surplus declines by $1+$1 = $2. | ||||||||||||||
![]() |
a. | Welfare loss = E+F = (1/2)(18-12)(4-2) + (1/2)(12-8)(4-2) = 6+4 = 10 |
b. | Welfare loss = G+H = 9+13.5 = 22.5 | |
5. | a. | P=25 cents; Q = 5 thousand | ![]() |
b. | Excess supply = 4 thousand | ||
c. | Excess demand = 6 thousand | ||
d. | Net gain = 20 cents | ||
e. | Net loss = 30 cents | ||
f. | QL = 3000 => Welfare loss from underproduction: 1/2 x (5000-3000) x ($0.35 - $0.15) = $200. QH = 8000 => Welfare loss from overproduction: 1/2 x (8000-5000) x ($0.40 - $0.10) = $450.
|
||
6. | a. | 25 cents. See diagram | ![]() |
b. | (1) Q=Q1, AB = welfare loss
(2) Q=Q2, C = welfare loss |
||
c. | Underproduction: MB > MC
out to Q*. The foregone output yields more in benefits than it costs society to produce. Overproduction: MC > MB beyond Q*. The excess output costs more than it is worth to consumers. |
||
7. | a. | The figure to the right illustrates the demand for medical care. If each procedure has a price of $100, quantity demanded will be Q1 procedures. | ![]() |
b. | If consumers pay only $20 per procedure, the quantity demanded will be Q2 procedures. Since the cost to society is $100, the number of procedures performed is too large to maximize total surplus. The quantity that maximizes total surplus is Q1 procedures, which is less than Q2. | ||
c. | The use of medical care is excessive in the sense that consumers get procedures whose value is less than the cost of producing them. | ||
d. | Several are possible. Examples: (1) Make the consumer bear the marginal cost of the procedure by eliminating insurance. (2) Let the insurance company decide whether the procedure should be performed (But the insurance company doesn't get the benefits of the procedure, so its decisions may not reflect the value to the consumer.) | ||
8. | a. | TE rises. e<1 => P and TE move in the same direction. |
b. | TE falls: e>1 => P and TE move in opposite directions. | |
c. | TE remains constant: e=1, so TE remains constant when P changes. | |
9. | Tom's price elasticity of demand is zero, since he wants the same quantity regardless of the price. Jerry's price elasticity of demand is one, since he spends the same amount on gas, no matter what the price, which means his percentage change in quantity is equal to the percentage change in price. | |
10. |
A worldwide drought could increase the total revenue of farmers if the price elasticity of demand for grain is inelastic. The drought reduces the supply of grain, but if demand is inelastic, the reduction of supply causes a large increase in price. Total farm revenue would rise as a result. If there's only a drought in Kansas, Kansas's production isn't a large enough proportion of the total farm product to have much impact on the price. As a result, price is about unchanged, while the output of Kansas farmers declines, thus reducing their income. | |
11. | a. |
|
![]() |
|||||||||
b. | CS= TB - TE | |||||||||||
c. | See diagram. change in CS = AB. | |||||||||||
d. | Value for change in CS = .5x507 + ½ x .5 x 328 = 335.5 | |||||||||||
e. | Elastic: P and TR moved in opposite directions. | |||||||||||
12. | (1) | Demand is inelastic: The increase in fares raised revenues. |
(2) | TLC thought e=0 (perfectly inelastic). Only if Qd doesn't change at all can revenues rise as much as the fares rise. | |
(3) | MTBT thought demand was more elastic (sitll inelastic, but e>0), since they recognized that fares would have to rise more than 17.5% for a 17.5% increase in revenues. | |
13. | a. | Sunk costs are costs already incurred and now nonrecoverable whatever you do. Variable costs depend on your current decision, so they tell you your opportunity cost. | |
b. | (1) | TC = $2,000+$.04x10,000 = $2,400 => average cost per mile = $2,400/10,000 = $.24 | |
(2) | Drive: cost = $.04 x 200 = $8, much less than the $35 ticket. | ||
14. | Finish. Benefits are 2/3 of what you first thought, but marginal costs are now only 1/2 of what they were at first. You cannot recover the sunk cost of the first 2 years. | |