Price elasticity of demand: Worksheet
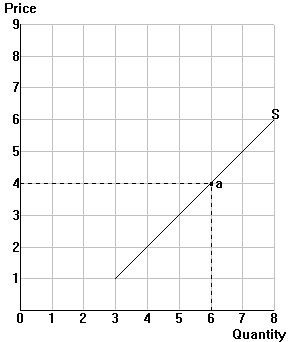
In the diagram to the right, the initial market
equilibrium is at point a. Your example number: ______ |
![]() |
|
1. | Draw your demand curve | |
2. | Suppose that the marginal cost of producing cigars rises by exactly $4 per unit. Carefully draw the new supply curve in your diagram, and label the new equilibrium price and quantity. | |
3. | Use your diagram to contrast the total expenditure (TE=PxQ)
of consumers before and after the price change. Shade in TE as follows: /// = TE before the price change \\\ = TE after the price change |
|
4. | Use the information from your diagram to answer each of the following questions, and be sure everyone in your group agrees about the answers: | |
(1) | Does the equilibrium quantity of cigars (1) rise, (2) fall,
or (3) remain the same?
|
|
(2) | Does the equilibrium price of cigars (1) rise by more than
$4, (2) rise by exactly $4, (3) rise by less than $4,
(4) remain the same as before, or (5) fall?
|
|
(3) | Does the total expenditure on cigars (P x Q) by consumers (1) rise, (2) fall, or (3) remain the same? | |