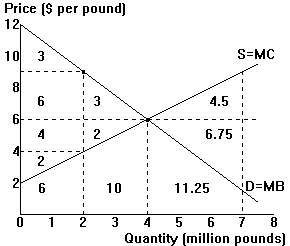
| Consider the following diagrams: General case: | Ostrich market example (values = $ million) |
|
 |
The Invisible Hand(out): How markets maximize social welfare
| Consider the following diagrams: General case: | Ostrich market example (values = $ million) |
|
 |
| Area (left-hand diagram) |
Value ($M) (right-hand diagram) |
|
| Equilibrium: | ||
| Total surplus: | ______ | ______ |
| Underproduction (QL) | ||
| Total surplus: | ______ | ______ |
| Welfare loss: | ______ | ______ |
| Overproduction (QH) | ||
| Total surplus: | ______ | ______ |
| Welfare loss: | ______ | ______ |
Notice the result which occurs with free markets: buyers and
sellers, each making their own benefit-cost decisions, automatically end up at the price
and output which maximize society's total surplus (which shows up as the distance between
the demand and supply curves out to the quantity marketed).
It is this result which underlies the conclusion of Adam Smith
in 1776: "As every individual endeavors to employ his [effort] so that its produce
may be of the greatest value, every individual necessarily renders the annual [surplus] of
the society as great as he can. He neither intends to promote the public interest, nor
knows how much he is promoting it, [but] he is in this led by an invisible hand to promote
an end which was no part of his intention."