| Event A | Event B | |||||||||||||
 |
 |
|
||||||||||||
|
||||||||||||||
| Event C | Event D | |||||||||||||
 |
 |
|
||||||||||||
|
||||||||||||||
| Event E | Event F | |||||||||||||
 |
 |
|
||||||||||||
|
Mink farming exercise: worksheet
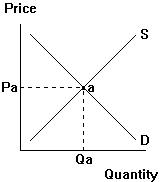
For each event, draw the new supply and/or demand curve for the domestic mink market, and label the new equilibrium price and quantity. Complete the tables to the right each pair of diagrams to indicate whether each event and pair of events combined would tend to make the equilibrium price and quantity rise (h), fall (i), remain the same (f) or change in an uncertain direction (?).
| Event A | Event B | |||||||||||||
 |
 |
|
||||||||||||
|
||||||||||||||
| Event C | Event D | |||||||||||||
 |
 |
|
||||||||||||
|
||||||||||||||
| Event E | Event F | |||||||||||||
 |
 |
|
||||||||||||
|
[A] In the industry's peak year, 1966, about 6,000 mink farms were
operating in the U.S. Today, there are 1,221 according to the U.S. Agriculture Department.
(Depict the consequence of the change in the number of farms.)
[B] The industry's descent has been as rapid as its rise in the 1950s
and 1960s, during which time mink grew in popularity as a fashionable status symbol.
(Depict the boldface text.)
[C] Feed and labor costs have
climbed rapidly.
[D] Competition from less-expensive
foreign pelts has heightened. (Keep in mind that the market you are showing is the
market for domestic mink.)
[E] Mink researchers have been
working to develop a dry diet that would be more economical and still satisfy the taste
and nutritional requirements of the animal. (Assume that the research is successful.)
[F] Some observers expect a pickup
in business as the recession eases.