Jim Whitney
  Trade policy analysis 2: quantitative restrictions
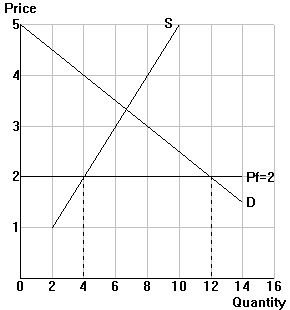
Example: The U.S. market for dairy products (Q=billion pounds)
A. Free trade: The diagram above illustrates the U.S. free-trade situation.
B. Quantitative restriction (QR): import quantity gets limited to a maximum of 2 (billion pounds).
        Step 1: In the diagram, draw the curve S+QR, the U.S. supply curve + the size of the quantitative restriction.
        Step 2: Label the new equilibrium price and quantities with the quantitative restriction.
        Step 3: Complete Table 1.
Table 1
Situation in the U.S.: Free trade QR
Price    
Quantity produced    
Quantity consumed    
Quantity imported    
C. Analysis: Comparing the quantitative restriction situation to free trade. 2 possibilities arise:
     C1: a 2 billion-pound import quota. The U.S. government gives import licenses to U.S. import firms. The firms can then buy dairy products at the world price and sell them in the U.S. at the new equilibrium price
     C2: a 2 billion-pound voluntary export restraint (VER). Foreign governments agree to restrict exports and then give export licenses to their countries' exporting firms. The firms can then export dairy products to the U.S. at the new equilibrium price in the U.S. Step 1: In the diagram, indicate the change in consumer surplus (\\\), producer surplus (///), and the  available quota rents/profits (|||). Step 2: Complete Table 2.
Table 2: QR consequences versus free trade
  Quota VER
  Area in graph Amount Area in graph Amount
Change in consumer surplus        
Change in producer surplus        
Domestic quota rents        
Change in national welfare