| Jim Whitney | Economics 311 |

Every possible free trade price ratio (p) determines
the economy's optimal production and consumption points.
Optimal production points (Qs) come from the tangency
between the PPF and the highest attainable free trade budget line.
Optimal consumption points (Qd) come from the tangency
between the free trade budget line and the highest attainable social indifference
curve.
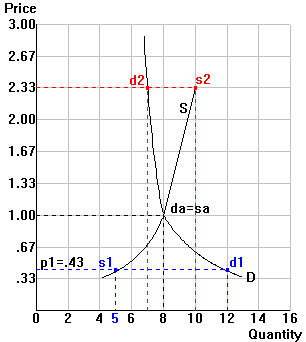
These tangency points can be used to derive "general
equilibrium" supply and demand curves. As an example, points have been
plotted for p1.
 To do: Continue the derivation for two more possible price ratios:
pa: the autarky price ratio
p2: the price ratio which makes U' attainable by
exporting A.
Then, in the bottom diagram, connect the points to
complete the illustration of the economy's general equilibrium supply and
demand curves.