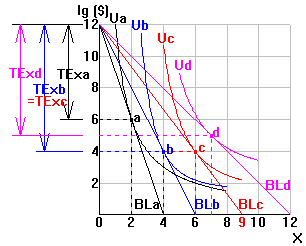
 Suppose your spend some income on X and the rest of it (Ig) on other goods.
Consider the sequence of optimal points as a decline in the price of X
moves you from a to d in the diagram to the right.
| Jim Whitney | Economics 250 |
 Suppose your spend some income on X and the rest of it (Ig) on other goods.
Consider the sequence of optimal points as a decline in the price of X
moves you from a to d in the diagram to the right.
Link the optimal consumption points in the diagram. This is the price consumption curve (PCC).
Notice how you slide down along your budget line,
giving up income (measured on the vertical axis) to acquire X. The income
given up = your total expenditure on X (TEx).
 These TEx's are shown in the top righthand diagram.
Indicate whether each of the following rises (+),
falls (-), remains constant (0) or changes in an uncertain direction (?)...
From From From
a to b b to c c to d
PCC:
______ ______ ______
TEx:
______ ______ ______
Based on your answers above, indicate whether the
demand for X is inelastic (<1), unit elastic (=1) or elastic (>1)...
From From From
a to b b to c c to d
______ ______ ______
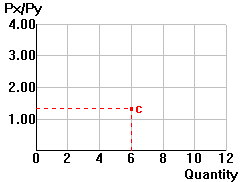
In the lower right hand panel, plot the demand relationship
between the relative price of X and the consumption of X.
Note: this analysis works basically the same if
you have a specific good Y on the vertical axis instead of income spent
on other goods (Ig). There are 2 minor differences:
(1) The Marshallian demand curve in the bottom diagram
has Px/Py on the vertical axis.
(2) The vertical drop along each budget line shows
you how much Y you give up to buy X. It remains true that if you give up
more Y as Px/Py falls, then the demand for X must be elastic and vice versa,
since I = PxX + PyY, so if you buy less Y, you must spend more on X and
vice versa.