| Jim Whitney |
Economics 250 |
Monopoly and output (allocative) efficiency
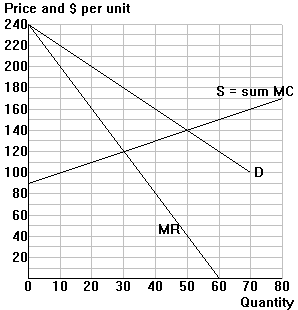
The diagram below initially represents market demand and supply for
a competitive industry. The supply curve represents the horizontal sum
of the individual firms' marginal cost curves. (Ignore the MR curve for
now.)

1a. Complete the following table contrasting
the situations under competition and monopoly:
| |
(1)
|
(2) |
(3) |
| |
Competition |
Monopoly |
Change (2)-(1) |
| Consumer surplus |
|
|
|
| Producer surplus |
|
|
|
| Combined (market) surplus |
|
|
|
1b. In the diagram, use the pattern "///"
to shade in the the welfare (deadweight) loss caused by the monopoly.
Now suppose that there is a price ceiling set for the monopoly at a
price of $160. The price ceiling changes the price and marginal revenue
situation faced by the monopolist.
2a. Complete the following table:
| |
Q < or = 40 |
Q > 40 |
| Price: |
|
P = 240 - Q |
| MR: |
|
MR = 240 - 2Q |
2b. Add the price ceiling to your diagram,
and highlight the new MR curve faced by the monopolist.
2c. Given the price ceiling:
--How much output would the monopolist
choose to maximize its profits? ______
--In the diagram (1) indicate the
new output level and (2) use the pattern "\\\" to shade in the new welfare
loss.
2d. What output level would the monopolist
choose with a price ceiling of $130? ______
--Is the welfare loss >, <, or
= the welfare loss with the price ceiling of $160? ______
2e. What level of price ceiling would
achieve output efficiency? ______

