| Jim Whitney | Economics 101 |
Episode 1: The Negative Demand Shock of the Great Depression

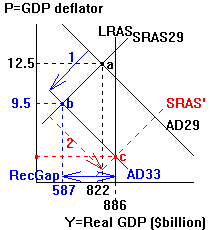
2. As a result of the negative demand shock (which had multiple causes including a world-wide financial panic, a negative shift of expectations and some erroneous fiscal and monetary policies) aggregate demand shifts from AD29 to AD33. We would predict that real GDP would fall, P would fall and the unemployment rate would rise. As the data for 1933 show, each of these predictions is directionally correct.
3. The recessionary gap is marked in the diagram and equals the gap between Yf ($886 billion) and the acutal output level in 1933 ($587 billion), an amount equal to $299 billion in 1987 dollars. With unemployed resources, the self-correction mechanism in principle says that nominal resource prices should fall and shift SRAS29 towards SRAS' -- thus we would predict that the self-correction mechanism would raise real GDP, lower P and lower the unemployment rate. As the data show, the model predicts correctly the direction of change of real GDP and the unemployment rate but instead of falling, the price level rises.
4. Comment: It would seem that nominal resource prices
did not fall as the self-correction mechanism predicts. Many (but by no
means all) economists think that there is an asymmetry in the operation
of the macroeconomic self-correction mechanism: they think it works well
to eliminate an inflationary gap (as it appears to have done in the Korean
War episode) but that it does not work well to eliminate a recessionary
gap because wages and prices are less flexible in a downward direction
than they are in an upward direction. .
Why then did prices rise, real GDP rise and the
unemployment rate fall? It would seem that only increased aggregate demand
could account for these changes.

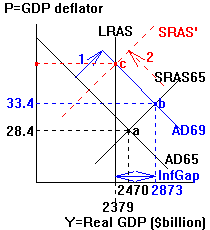
2. As a result of the positive demand shock caused by increased government spending (demand) associated with the Vietnam War, AD shifts to AD69. We predict that P would rise, real GDP would rise and the unemployment rate would fall. As the data for 1967 show, each of these predictions is directionally correct.
3. The inflationary gap is indicated in the diagram and is the gap between actual 1967 output of $2873 billion and full-employment output of $2379 billion, an amount equal to $494 billion of extra output (valued at 1987 prices). With excess demand for resources, the self-correction mechanism in principle says that nominal resource prices should rise and shift SRAS63 up towards SRAS' -- thus we would predict that the self-correction mechanism would lower real GDP, raise the price level and raise the unemployment rate. As the data for 1970 show, prices and unemployment move in the predicted direction, but real GDP rises slightly instead of falling.
4. Comment: For real GDP and the price level to both
rise, AD must have shifted to the right. But how then could the unemployment
rate rise at the same time? This would happen only if the size of the work
force rose significantly so that the increase in real GDP was not sufficient
to employ all the new workers, thus raising the rate of unemployment. A
quick check of the data shows that the labor force rose from 77.3 million
in 1967 to 82.8 million in 1970.

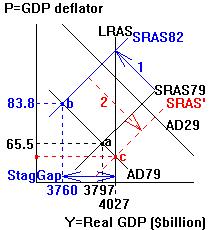
2. As the result of both a reduction in the world supply of oil and inflationary expectations that had built up during previous years, SRAS79 shifts to SRAS82. We would predict that P would rise, real GDP would fall and the unemployment rate would rise. As the data for 1982 show, each of these predictions is directionally correct.
3. The "stagflationary" gap -- a recessionary gap combined with a rise in prices -- is indicated in the diagram and corresponds to the gap between full employment output of $4027 billion and the actual output level of $3760 billion, an amount equal to $267 billion dollars of output (valued at 1987 prices). With unemployed resources, the self-correction mechanism in principle says that nominal resource prices should fall and shift SRAS82 towards SRAS' -- thus we would predict that the self-correction mechanism would raise real GDP, lower the price level and lower the unemployment rate. As the data for 1984 show, the predictions for real GDP and unemployment are correct, but prices rise instead of falling.
4. Comment: Strictly speaking, for both real GDP
and the price level to rise, the AD curve must have shifted to the right.
However, if we complicate our thinking a bit (and as a result push it closer
to reality), we could argue that while the self-correction mechanism didn't
bring the price level down, it might have brought down the rate of increase
of the price level (inflation). A quick check of Appendix B shows that
in fact the rate of inflation fell from 6.2% in 1982 to 4.4% in 1984. So
perhaps a recessionary gap works not to lower prices (deflation) but instead
to lower the rate of inflation (disinflation).