|
 |
 |
| U.S. market | Trade market | German market |
Supply and Demand Geometry for International Trade: The world beer market
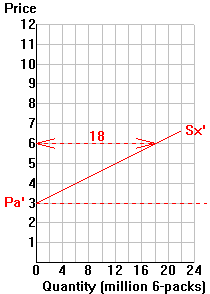
The trade market depicts the direct interaction between
importing and exporting countries. The supply and demand curves specific to the trade
market are:
Dm = the demand for imports by the
buying country, and
Sx = the supply of exports by the selling country.
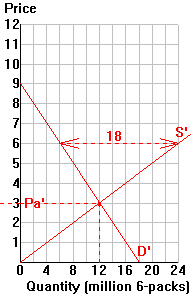
This handout illustrates how these two curves are linked to the domestic markets of
two trading countries.
For example, consider the possibility of U.S. and German trade in beer.
Each country has a domestic autarky (no trade) equilibrium based on its own supply and
demand conditions. If the world price is above the country's autarky price (Pa), the
country would like to export beer. If the world price is below the country's autarky
price, the country would like to import beer. Specifically:
For any price > Pa, Qx = Qs - Qd
(where Qx = quantity supplied of exports).
For any price < Pa: Qm = Qd - Qs (where Qm =
quantity demanded of imports).
Use these relationships and the domestic-market supply and demand curves below to
finish completing the table:
| U.S. | ******** | Germany (') | ||||||||
| Trade | Trade | |||||||||
| P | Qd | Qs | Direction | Quantity | P | Qd | Qs | Direction | Quantity | |
| 7.00 | 8 | 11 | X | Qx = 3 | 7.00 | 4 | 28 | X | Qx = 24 | |
| 6.00 | 10 | 10 | 0 | Q = 0 | 6.00 | 6 | 24 | X | Qx = 18 | |
| 5.00 | 12 | 9 | M | Qm = 3 | 5.00 | 8 | 20 | ___ | ________ | |
| 4.00 | 14 | 8 | ___ | ________ | 4.00 | 10 | 16 | ___ | ________ | |
| 3.00 | 16 | 7 | ___ | ________ | 3.00 | 12 | 12 | ___ | ________ | |
| 2.00 | 18 | 6 | ___ | ________ | 2.00 | 14 | 8 | ___ | ________ | |
Depicting the U.S.-German trade market equilibrium: In the 'Trade market'
diagram below:
Step 1: Plot the autarky price of the U.S. (Pa) on the
vertical axis (Germany's has been plotted as Pa').
Step 2: Draw the U.S. import demand (Dm) curve for possible trade
prices below Pa ($6).
Step 3: Use Dm and Sx' to determine the equilibrium free-trade price
and quantity traded.
|
 |
 |
| U.S. market | Trade market | German market |