Comparing tariffs, quotas and VERs
How are tariffs and quantitative restrictions
similar? For every quantitative restriction (QR) there is an equivalent tariff, and
vice versa.
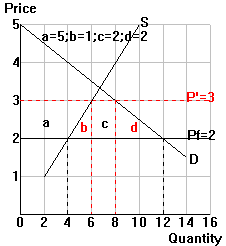
For example, consider the diagram below for dairy products (with
quantity measured in billions of pounds). The diagram shows a quantitative restriction of
2 billion pounds which raises the U.S. price of dairy products from $2 to $3 per pound. A
$1 tariff would have had exactly the same effect on price, production, consumption and
imports. The equivalent tariff also causes the same efficiency loss as the quantitative
restriction (b+d = $3 billion dollars).

How are tariffs and quantitative restrictions
different? The differences between tariffs, quotas and VERs all arise from what
happens to area c in the diagram. Area c is surplus revenue that comes from selling the
restricted imports for a higher price in the home country than the imports actually cost
on the world market. The issue is: who gets the surplus revenue? (Note: in economics, the
term "rent" refers to revenue in excess of opportunity cost, so the surplus
revenue in this case is commonly referred to as "quota rents.")
With a tariff, area c is kept by the importing country
since it is tariff revenue collected by the government of the importing country.
With a quota, area c may be kept by the importing
country. That will happen if the importing country government auctions off the import
licenses to the highest bidder or gives all the import licenses to domestic residents.
With a VER, area c is not kept by the importing country.
The exporting countries get it, since they get to auction off the trade permits as export
licenses or give them to their own residents.
So, we can rank these three trade policy options as follows:
A quota is at least as bad as a tariff, and it is worse if
any of the quota rents leak out to exporting countries.
A VER is at least as bad as a quota, and it is worse if any
of the quota rents would not have leaked out to exporting countries with an import
quota.