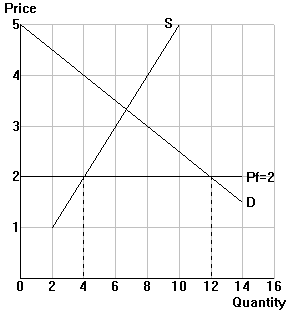
Example: The U.S. market for dairy products (Q=billion pounds) |
|||||||||||||||||||||
 |
|||||||||||||||||||||
A. Free trade: The diagram above illustrates the U.S. free-trade situation. B. Quota: import quantity gets limited to a maximum of 2 (billion pounds). B1: Price and quantity effects Step 1: In the diagram, draw the curve S+quota, the U.S. supply curve + the size of the quantitative restriction. Step 2: Label the new equilibrium price and quantities with the quantitative restriction. Step 3: Complete Table 1. |
|||||||||||||||||||||
|
|||||||||||||||||||||
B2. National welfare effects Step 1: In the diagram, indicate the change in consumer surplus (\\\), producer surplus (///), and the available quota rents/profits (|||). Step 2: Complete Table 2. |
|||||||||||||||||||||
|
|||||||||||||||||||||