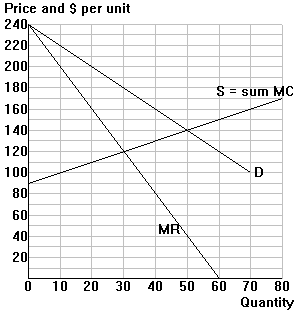
The diagram to the right initially represents
market demand and supply for a competitive industry. The supply curve represents the
horizontal sum of the individual firms' marginal cost curves. (Ignore the MR curve for
now.) |
 |
Monopoly and output (allocative) efficiency
The diagram to the right initially represents
market demand and supply for a competitive industry. The supply curve represents the
horizontal sum of the individual firms' marginal cost curves. (Ignore the MR curve for
now.) |
|
| Part 1: Unregulated monopoly: | ||||||||||||||||||||||
| 1. | a. | Complete the following table contrasting the situations under competition and monopoly: | ||||||||||||||||||||
|
||||||||||||||||||||||
| 1. | b. | In the diagram, use the pattern "///" to shade in the the welfare (deadweight) loss caused by the monopoly. | ||||||||||||||||||||
| Part 2: Regulated monopoly: Now suppose that there is a price ceiling set for the monopoly at a price of $160. The price ceiling changes the price and marginal revenue situation faced by the monopolist. | |||||||||||
| 2. | a. | Complete the following table: | |||||||||
|
|||||||||||
| b. | Add the price ceiling to your diagram, and highlight the new MR curve faced by the monopolist. | |
| c. | Given the price ceiling: --How much output would the monopolist choose to maximize its profits? ______ --In the diagram (1) indicate the new output level and (2) use the pattern "\\\" to shade in the new welfare loss. |
|
| d. | What output level would the monopolist choose with a price
ceiling of $130? ______ --Is the welfare loss >, <, or = the welfare loss with the price ceiling of $160? ______ |
|
| e. | What level of price ceiling would achieve output efficiency? ______ | |