| Suppose you have a costume firm with the cost structure given in the table below. You are a perfectly competitive firm, so you can sell as many Halloween costumes as you want at the going market price. | ||||||||||||||||||||||||||||||||||||||||||||||||||||||||||||||||||||||||||||||||||||||||||||||||||||||
| Part 1: Suppose that the price = $13, and the following table summarizes your revenue and cost situation: | ||||||||||||||||||||||||||||||||||||||||||||||||||||||||||||||||||||||||||||||||||||||||||||||||||||||
|
||||||||||||||||||||||||||||||||||||||||||||||||||||||||||||||||||||||||||||||||||||||||||||||||||||||
| How much output should the firm produce to maximize profits? Q* = ________ | ||||||||||||||||||||||||||||||||||||||||||||||||||||||||||||||||||||||||||||||||||||||||||||||||||||||
| Part 2: Marginal analysis helps determine the firm's profit-maximizing output (Q*) for any possible market prices: | ||||||||||||||||||||||||||||||||||||||||||||||||||||||||||||||||||||||||||||||||||||||||||||||||||||||
| 2.1: Expand production as long as MR
> MC
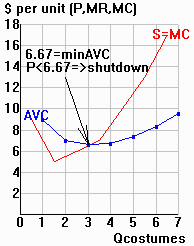
(the upward-sloping portion of MC). 2.2: If profits are < 0, check to be sure that TR > TVC (=> P > AVC). If not, shut down. |
||||||||||||||||||||||||||||||||||||||||||||||||||||||||||||||||||||||||||||||||||||||||||||||||||||||
|
 |
|||||||||||||||||||||||||||||||||||||||||||||||||||||||||||||||||||||||||||||||||||||||||||||||||||||
| Key lesson: The firm's supply curve = its
upward-sloping MC curve above its minimum AVC (for price < minimum AVC, Qs = 0). |
||||||||||||||||||||||||||||||||||||||||||||||||||||||||||||||||||||||||||||||||||||||||||||||||||||||