 |
 |
| U.S. domestic barley market | U.S. trade market for barley |
| Jim Whitney | Economics 131 |
Linking a country's domestic and trade markets
The trade market focuses on imports and exports of a
product rather than overall consumption and production. It depicts the direct interaction
between two importing and exporting countries.
Dm = the demand for imports by the buying country.
Sx = the supply of exports by the selling country.
These curves are linked to the domestic markets of the two trading countries, as
illustrated in this handout.
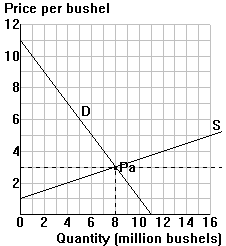
For example, consider the U.S. domestic and trade market for barley.
The domestic market has the usual supply and demand curves for barley,
as illustrated in the lefthand panel below. The initial price of $3 per bushel is the U.S.
autarky (no trade) price (Pa) of barley.
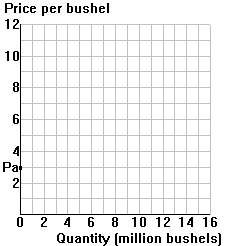
Deriving the demand for imports (Dm) and supply of exports (Sx) curve
of a single country:
Step 1: Plot the autarky price (Pa) on the
vertical axis of the trade market. That shows that if the free trade price of barley = Pa,
then the traded quantity will be 0--the U.S. will neither export nor import barley.
Step 2: Draw the U.S. import demand (Dm) and export
supply (Sx) of barley according to the following rules:
For any price < Pa, the U.S. will import barley:
Qdm = Qd - Qs.
For any price > Pa, the U.S. will export barley:
Qsx = Qs - Qd.
(1) Fill in the missing values for the example here:
| P | Qd | Qs | Qtraded |
| 5.00 | 6 | 16 | Qx = 10 |
| 4.00 | 7 | 12 | ________ |
| 3.00 | 8 | 8 | ________ |
| 2.00 | 9 | 4 | ________ |
| 1.00 | 10 | 0 | ________ |
(2) Plot the U.S. export supply curve (Sx) and import demand curve (Sm) in the righthand panel below:
|
|
| U.S. domestic barley market | U.S. trade market for barley |