| Jim Whitney | Economics 102 |
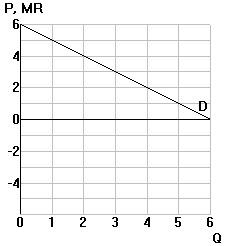
1. The information in the first two columns of the
table below come from the demand curve drawn in the diagram at the bottom
of the page.
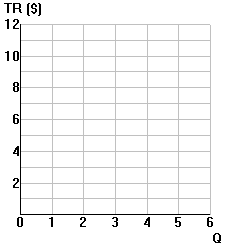
Step 1: Fill in the rest of the table:
| P | Q | TR=P·Q | MR=DTR/DQ | Accounting for MR | |
| Rev.gain from the unit
sold at the new price |
Rev.loss from the price drop
on the rest of the output |
||||
| $6 | 0 | $0 | $--- | $--- | $--- |
| 5 | 1 | 5 | 5 | 5 | 0 |
| 4 | 2 | 8 | 3 | 4 | 1 (= $1·1 unit) |
| 3 | 3 | ||||
| 2 | 4 | ||||
| 1 | 5 | ||||
| 0 | 6 | ||||