| Suppose
the U.S. can produce steel itself and also buy or sell as much steel as
it wants on the world market at a price of $400 per ton. The market is
depicted in the supply and demand diagram to the right.
A=64
|
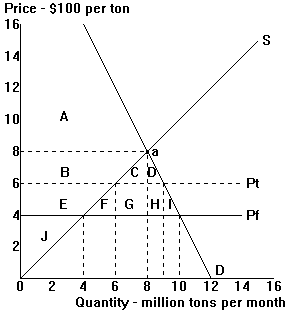 |
Free trade versus protection
| Suppose
the U.S. can produce steel itself and also buy or sell as much steel as
it wants on the world market at a price of $400 per ton. The market is
depicted in the supply and demand diagram to the right.
A=64
|
|
Pre-trade versus free trade (with free-trade price (Pf) = $400 per ton):
| Pre-trade | Free trade | Change | |
| Price | |||
| Quantity consumed | |||
| Quantity produced | |||
| Quantity imported | |||
| Consumer surplus | A = | ABCDEFGHI = | |
| Producer surplus | BEJ = | J = | |
| National welfare | ABEJ = | ABCEDFGHIJ = |
| Free trade | Tariff | Change | |
| Price | |||
| Quantity consumed | |||
| Quantity produced | |||
| Quantity imported | |||
| Consumer surplus | ABCDEFGHI = | ABCD = | |
| Producer surplus | J = | EJ = | |
| Government revenue | 0 | GH = | |
| National welfare | ABCDEFGHIJ = | ABCDEJGH = |