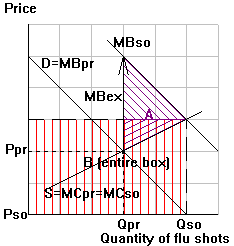
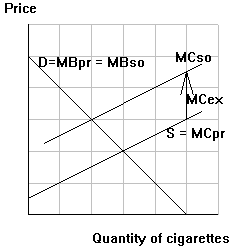
Step 1: Add the following labels to your diagram:
QPR: the private market's equilibrium quantity (hint: where does MBPR = MCPR?)
PPR: the private market's equilibrium price
QSO: the socially optimal quantity (hint: where does MBSO = MCSO?)
A: the welfare loss at QPR
Step 2: Indicate what policy you would recommend to move consumption to QSO
For cigarettes: _________
For flu shots: subsidy
Step 3: Add the following labels to your diagram:
PSO: the price paid by buyers at your new equilibrium
B: the government's revenue or expenditure at the new equilibrium
For cigarettes: ____________
For flu shots: B=expenditure