| 1. | a. | CS = ABE = $180. PS = CDF = $180 | 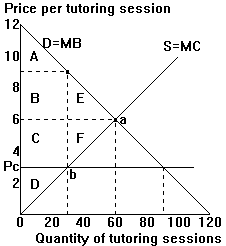 |
| b. | Pc = 3 --> Qs = 30; Qd = 90 | ||
| c. | New CS = ABC = $225.
New PS = $45
Welfare loss = EF = $90 |
||
| d. | CS rises. | ||
Problem Set 3: Key
| 1. | a. | CS = ABE = $180. PS = CDF = $180 |  |
| b. | Pc = 3 --> Qs = 30; Qd = 90 | ||
| c. | New CS = ABC = $225.
New PS = $45
Welfare loss = EF = $90 |
||
| d. | CS rises. | ||
| 2. | Correct: "Cuts in support prices run the risk of driving many dairy farmers out of business." Incorrect: "higher milk prices." Cutting a price floor reduces Qs, but only because P falls. | |
| 3. | a. | See diagram to right for tax | 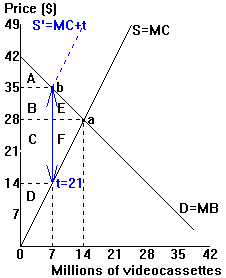 |
| b. | Change in CS = -BE = -$73.5
Change in PS = -CF = -$147 Tax revenues = BC = +$147 Change in TS = -EF = -$73.5 |
||
| 4. | a. | See diagram. | 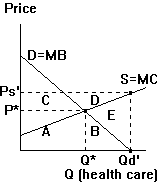 |
|
| (1) | New Q: Qd' | |||
| (2) | New price to sellers: Ps' | |||
| b. | (1) | chCS: +AB | ||
| (2) | chPS: +CD | |||
| (3) | cost to government: -ABCDE | |||
| 5. | a. | Programs aimed at making the public aware of the dangers of smoking reduce the demand for cigarettes, shown in the figure to the right as a shift from demand curve D to D'. The price support program increases the price of tobacco, which is the main ingredient in cigarettes. As a result, the supply of cigarettes shifts to the left, from S to S'. The effect of both programs is to reduce the quantity of cigarette consumption from Q1 to Q2. | 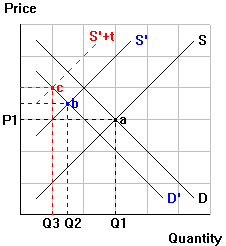 |
| b. | The combined effect of the two programs on the price of cigarettes is ambiguous. The education campaign reduces demand for cigarettes, which tends to reduce the price. The tobacco price supports raise the cost of production of cigarettes, which tends to increase the price. | ||
| c. | The taxation of cigarettes further reduces cigarette consumption, since it increases the price to consumers. As shown in the figure, the quantity falls to Q3. | ||
| 6. | False. Vac. are offered at no charge because of important external benefits associated with them (they protect each child from spreading the diseases as well as from getting them). | |
| 7. | a. | See diagram P = 120; Q = 4000 tons | 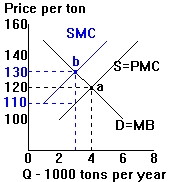 |
| b. | Efficient P = 130; Q=3000 tons | ||
| c. | Impose a tax = $20, the size of the external cost. The tax lowers Q to 3000 tons. PBt rises to $130. PSt falls to $110. | ||
| 8. | The figure to the right shows a situation in which studded snow tires should be banned completely. The demand curve intersects the supply curve at a positive quantity, Qo. But if the damage to highways caused by the studded tires raises the social marginal cost curve (SMC) entirely above the demand curve, the efficient quantity is 0, and studded snow tires should be banned. If SMC = SMC' instead, then the efficient quantity is > 0. | 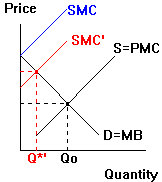 |
|
| 9. | a. |
|
 |
||||||||||||
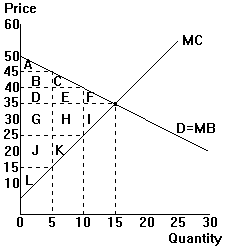
| The producer gains $25, the excess of transferred CS (DE=$50) over PS lost from reduced sales (I=$25). | |||||||||||||||
| b. | Consumers lose DEF=$62.5. Producer can't capture CS (F=$12.5) or PS (I=$25) on units no longer sold. That's the welfare loss to society as a whole. | ||||||||||||||
| c. | No, worse off. PS=BDGL=$175. Even worse than P=35. Smith is wrong. Producers maximize PS, not price. Too high a price reduces PS by reducing sales volume too much. | ||||||||||||||
| 10. | Statement is wrong. Producer gains are less than consumer losses, so society as a whole loses. Shows up as welfare loss triangle in S&D diagrams. | |
| 11. | a. | Obstacles include: (1) setting up agreement (for example, agreeing on price); (2) enforcement against "cheating"; competition from nonparticipants (like Oxy); substitutes (working, community college); non-price competition (changing the mix of grants vs. loans, work-study, etc.) | |
| b. | Enforcement against cheating is the main problem mentioned: Smith and Mt.Holyoke are "a crack in the dike"; they are offering slightly more aid. Not all the competitors are included. | ||
| c. | (1) | Disagree. If the aid increase doesn't "make anyone change their mind," then Mt. Holyoke is foolish to offer it. | |
| (2) | Does not agree. Feels it does make a difference, or why "prefer Smith and Mt. Holyoke not to do it." | ||
| 12. | a. | Demand for computers shifts right, raising computer prices and profits, so demand shifts up/right for computer labor too (lefthand diagram). | 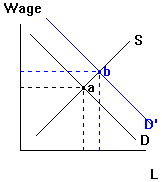 |
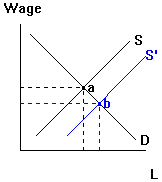 |
| b. | Supply shifts right (righthand diagram). | |||
| c. | New factories raise the productivity of computer workers, so demand shifts up/right (lefthand diagram). | |||
| 13. | a. | Higher productivity --> greater demand; high opportunity cost --> restricted supply. Both push up the wage. |
| b. | Bad hours (nonpecuniary factor) --> restricted supply, pushing the wage up. | |
| c. | Economic discrimination (customer discrimination or crowding model) can account for this. | |