MATH 150 DATA ANALYSIS
Average monthly temperatures in six big cities located at or around the latitude 34N and 34S
Los Angeles
Osaka
Sydney
Adelaide
Buenos Aires
Montevideo
Useful databases on the internet to obtain weather/climate and geographic information:
WashingtonPost.com: WeatherPost -- Historical Weather Data
Latitude and Longitude of World Cities
(a compiled list: with name, latitude, longitude, etc.)
(
Customized mean sea surface maps from altimeter data
(to draw partial maps constrained by given pairs of latitude and longitude values))
H
ow far is it?
(it searches by names for the selected pair of cities and returns the distance, latitudes, longitudes, etc.)
Positioning on the World Map
(click on the map to obtain coordinates and making maps)
Day and Night World Map
(plus links to local times)
Exploration by graphs
explanation of geographic terms (from the Encyclopaedia Britannica)
a partial map going between latitude values 34N and 34S
Los Angeles vs. Osaka: the two location on the map
Los Angeles vs. Buenos Aires: the two loacations on the map
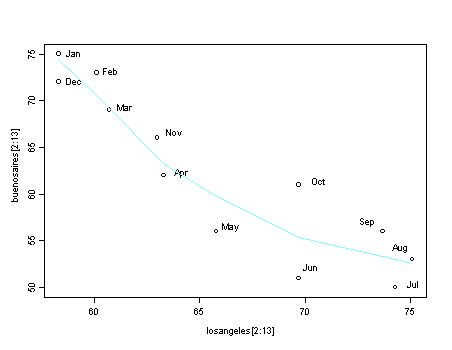
Los Angeles vs. Buenos Aires: scatterplot with months identified
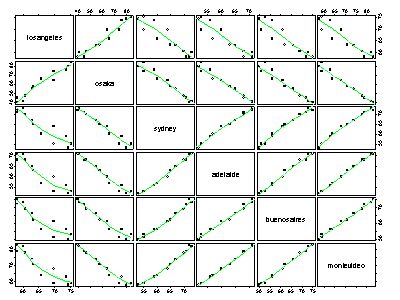
draftsman's display
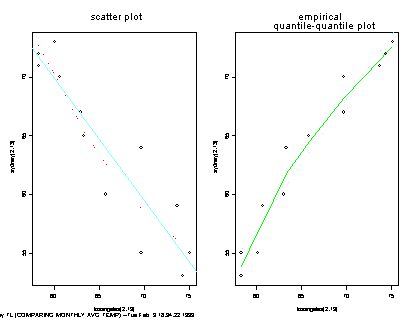
scatter plot vs. quantile-quantile plot
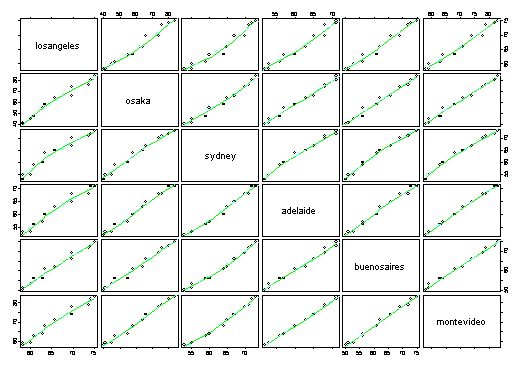
multipanel window with all quantile-quantile pairs
Question: which three cities are the most similar in terms of their temperature distributions?
(to answer this question you should take a closer look at the data...)
Made by TL, last modified on 02/10/2020